Article
The Higher Ed Guide to Instagram Story Highlights: What 500 Colleges Actually Keep

It is a new admissions cycle, which means we have been shuffling the Story Highlights on our own accounts.
MeetYourClass is social media infrastructure for institutions. Reach is our social media management and intelligence platform, and alongside it we run peer to peer Instagram communities for campuses across the country.
That means the audience on our accounts turns over completely this time of year. In May we are talking to admitted students about move in. By September we are talking to a brand new group of juniors and seniors who may be in the process of starting research. The highlights that made sense three months ago are the wrong ones now.
So we reordered. And while we were doing it, we got curious about what everyone else keeps under the bio.
Highlights are the part of a college profile nobody audits. They sit permanently beneath the bio, they can be the first thing a prospective student taps after landing on your account, and in almost every enrollment marketing plan we have seen they appear exactly nowhere. There is plenty written about what to post. There is almost nothing written about what to keep.
So we went and measured it. We took the 500 highest follower college Instagram accounts in our database, from @harvard at 3.3M followers down to schools around 27k, and pulled every highlight each one keeps. We also looked at all 2,857 cover images and pulled the words off the artwork, because plenty of schools put the real label on the picture instead of in the title.
What follows is meant as a guide. The first half is what higher ed is actually doing, which is the benchmark nobody has had. The second half is what we think you should do with it.
The Data: What Colleges Put in Their Highlights
13% of the biggest college accounts have no highlights at all
We expected this to be universal. It isn't.
66 of the 500 schools keep zero Story Highlights. That includes Duke, the University of Chicago, the University of Minnesota and the University of Delaware. Large, well resourced accounts with hundreds of thousands of followers and nothing under the bio.
The schools that use them keep about seven
Of the 434 schools that do keep highlights, the median is 7. Half the field sits between 5 and 9.
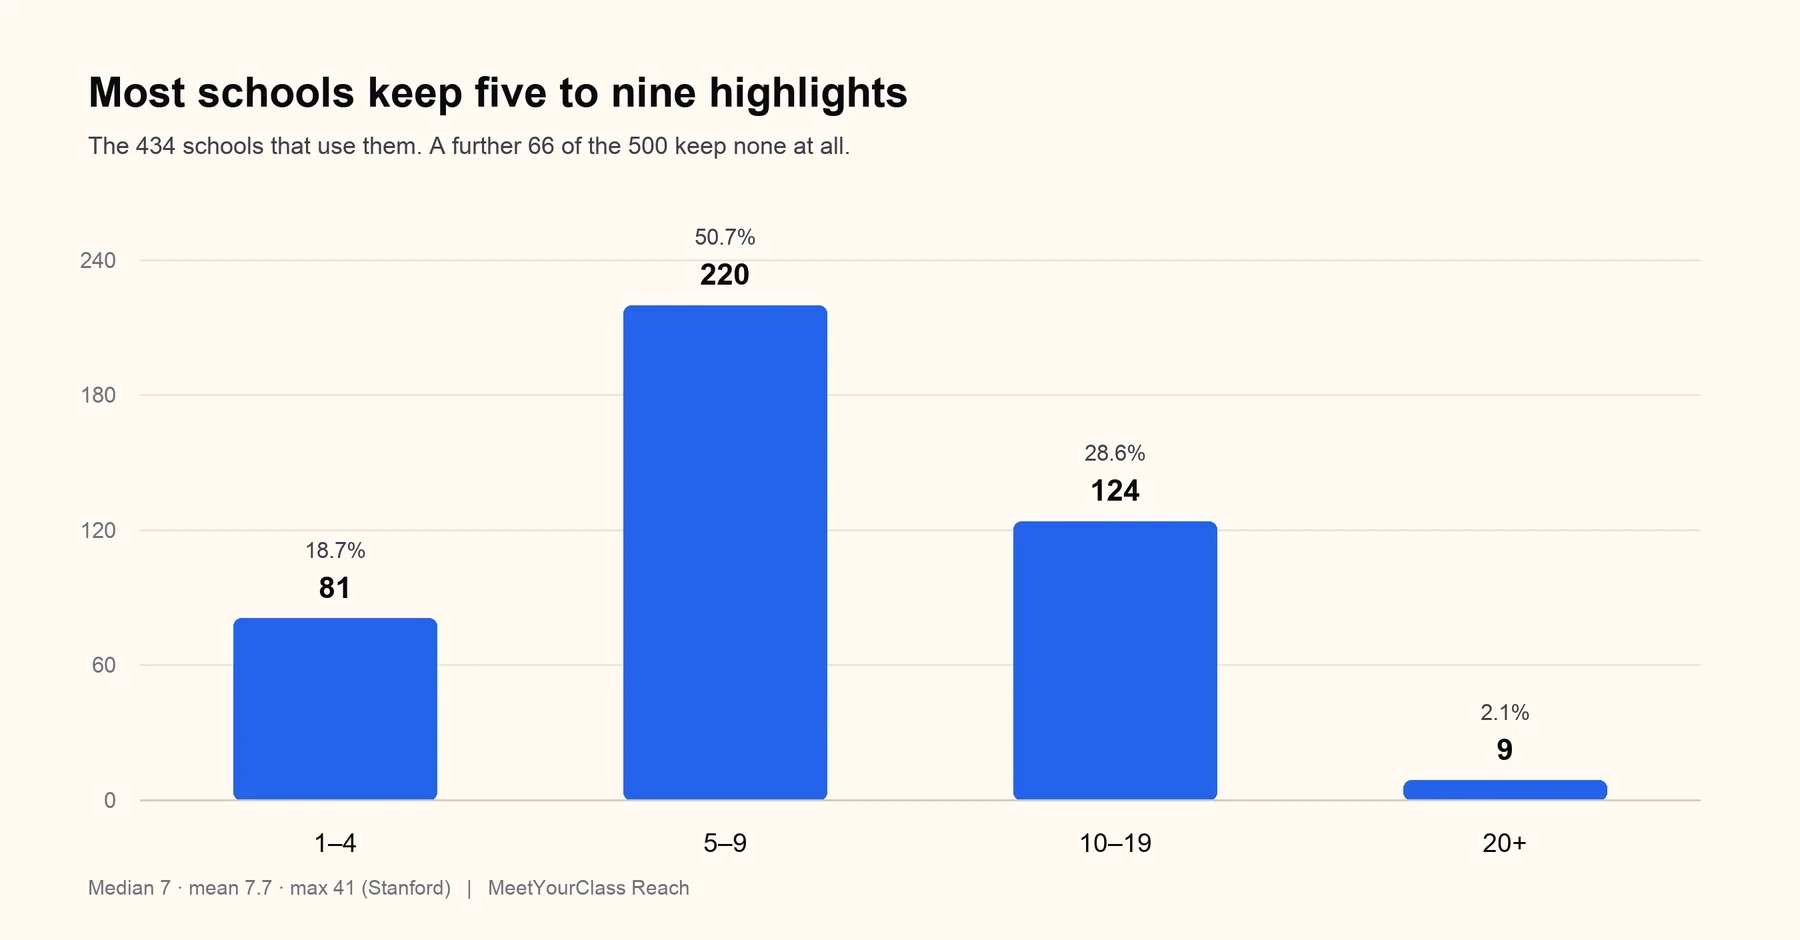
Distribution of Story Highlight counts across the schools that use them.
Scale barely moves it. A school with 250k or more followers averages 8.7 highlights. A school with 25k to 50k averages 7.1. Ten times the audience buys you about one extra highlight.
Nine schools run 20 or more.
Highlights | School | Followers |
|---|---|---|
41 | Stanford University | 1,456,435 |
38 | University of Nevada, Las Vegas | 62,803 |
33 | Wellesley College | 36,389 |
28 | Northern Arizona University | 106,405 |
27 | University of Utah | 176,468 |
25 | North Carolina A&T State University | 111,073 |
23 | Arizona State University | 287,658 |
20 | University of California, Irvine | 129,052 |
20 | University of Vermont | 82,942 |
Wellesley keeps 33 highlights on 36k followers. Arizona State keeps 23 on 288k. Shelf size is an editorial habit rather than a function of reach.
Graduation gets a highlight three times more often than applying
We classified all 3,357 highlight titles into 45 specific categories.
Category | Schools |
|---|---|
Graduation and commencement | 33.4% |
Resources, FAQ and how to | 29.0% |
News and announcements | 27.4% |
Event calendar | 27.4% |
Student life and clubs | 26.8% |
Campus views and photography | 25.8% |
Athletics and game day | 20.8% |
Wallpapers and downloads | 19.8% |
Apply and admissions info | 11.8% |
Campus tours and visits | 10.8% |
Yield and admitted student | 9.0% |
Class year cohort tags | 4.4% |
Graduation, the moment a student leaves, gets a dedicated highlight on 33.4% of profiles. How to apply gets one on 11.8%. A campus visit highlight, the most direct path from seeing you on Instagram to standing on your quad, appears on 10.8%.
There is also a category that is not really a category. 63% of schools keep at least one highlight whose name is a local proper noun or acronym. GEI. KOTS. TCT. Aggieland. Buckylist. Grand Kerfuffle. The Axe. Roughly one highlight in four is labeled in a language external visitors may be unfamiliar with.
The apply highlight sits fourth, the events highlight sits second
Highlights render most recently updated first, so the order of a profile is a record of what a team has been feeding. We reconstructed the true order of every profile from the sort key Instagram returns, which is exactly the negative of each highlight's last updated timestamp.
Highlight | Schools that have it | Median position | In the first three |
|---|---|---|---|
Events | 27.4% | 2nd | 72% |
Move in and welcome | 8.8% | 3rd | 60% |
Graduation | 33.4% | 3rd | 56% |
Apply and admissions info | 11.8% | 4th | 46% |
Campus tours and visits | 10.8% | 5th | 37% |
Yield and admitted student | 9.0% | 5th | 28% |
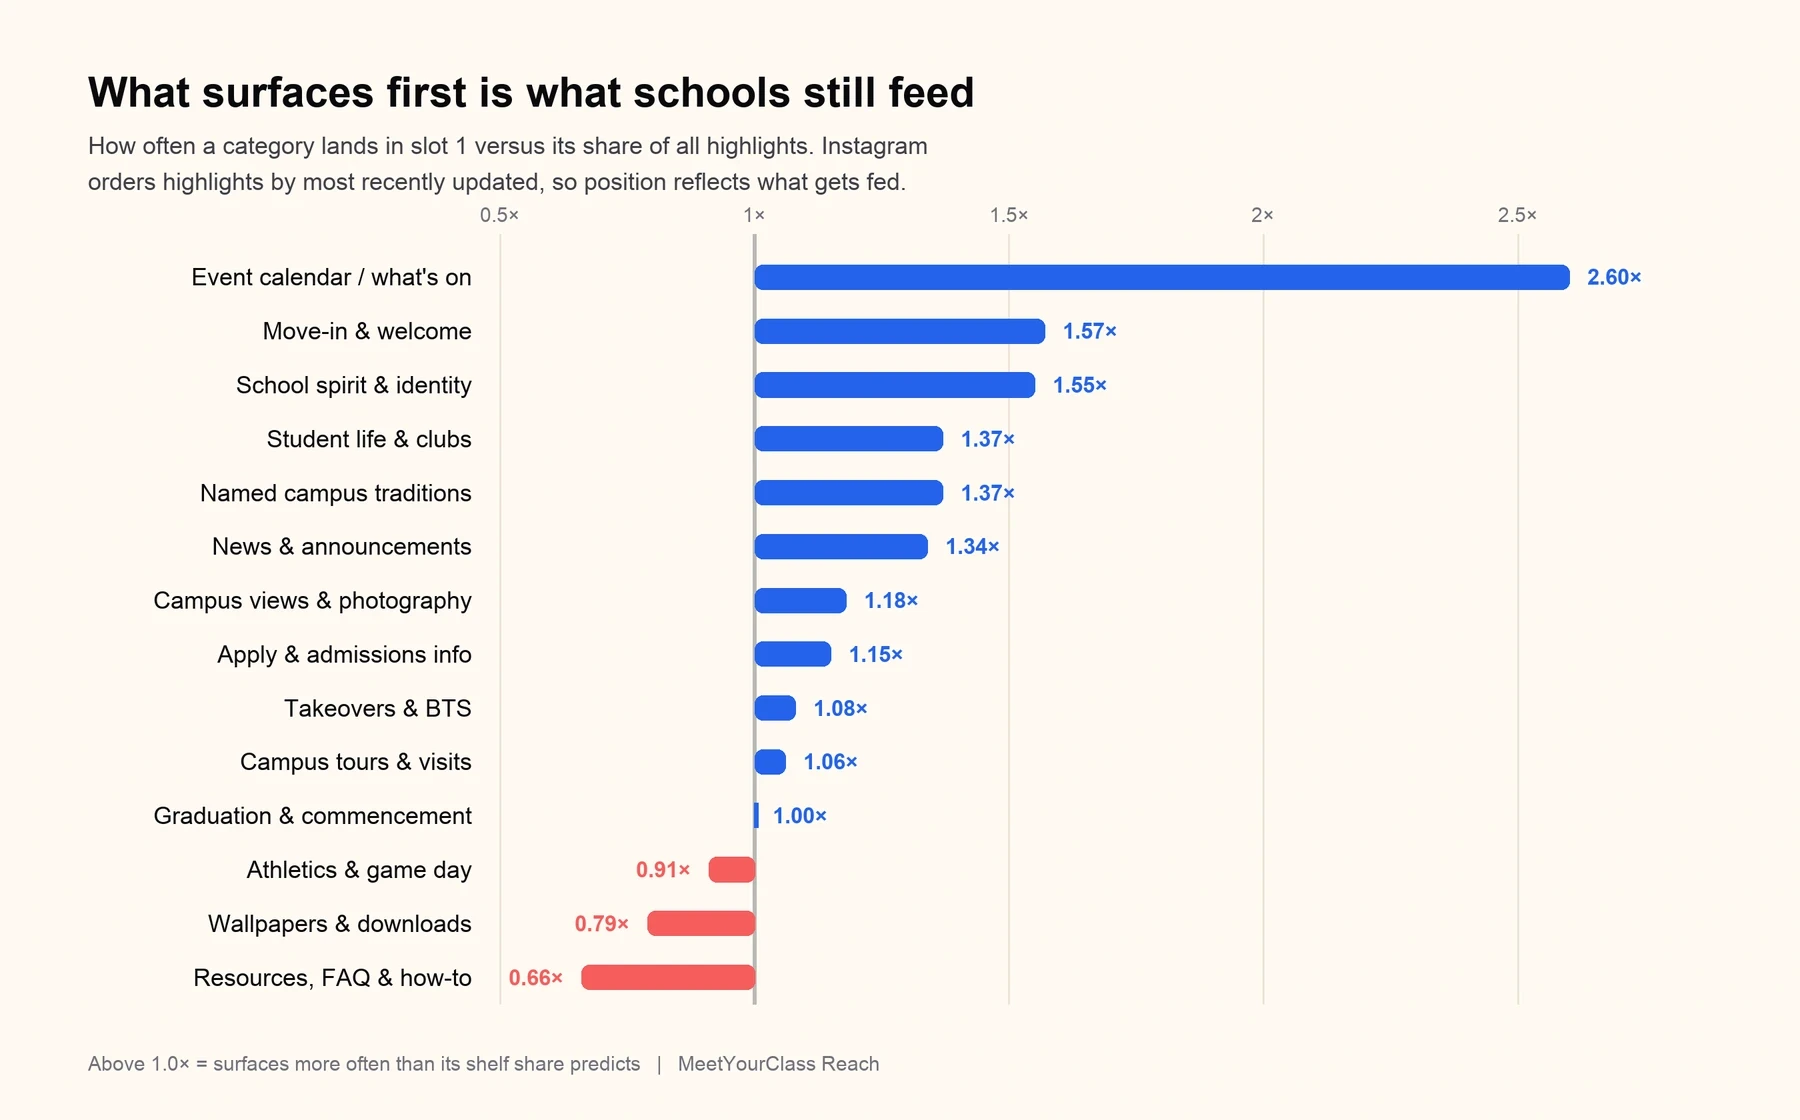
How often each category lands in the first slot, versus its share of all highlights.
The events highlight reaches the front 2.6 times more often than its share of the shelf predicts. Resources and wallpapers sink to the back.
Roughly one school in twenty has an application highlight sitting in the first three positions of their profile.
Most highlights were built in a single day and never touched again
Because we captured timestamps on individual stories, we could measure how long each highlight was actively built rather than just when it went quiet.
29% of all highlights were assembled in one day and never added to again. 39% were finished within a week. Half were done within a month. The median highlight has an active life of 34 days.
Active span is how long they fed it. Idle is how long since they last did.
Category | Active span | Idle since |
|---|---|---|
Apply and admissions info | 0 days | 344 days |
Housing and dining | 0 days | 399 days |
Class year cohort tags | 3 days | 484 days |
Homecoming | 5 days | 353 days |
Move in and welcome | 6 days | 31 days |
Event calendar | 6 days | 52 days |
Health, wellness and safety | 8 days | 750 days |
Campus tours and visits | 68 days | 455 days |
Study abroad | 128 days | 1,038 days |
Wallpapers and downloads | 272 days | 778 days |
The apply highlight has a median active span of zero days. Half the admissions highlights in the top 500 were built inside a single afternoon and have sat untouched for about a year since.
Move in and events have the same six day burst, because they are short by nature. The difference is that somebody comes back and rebuilds them every cycle.
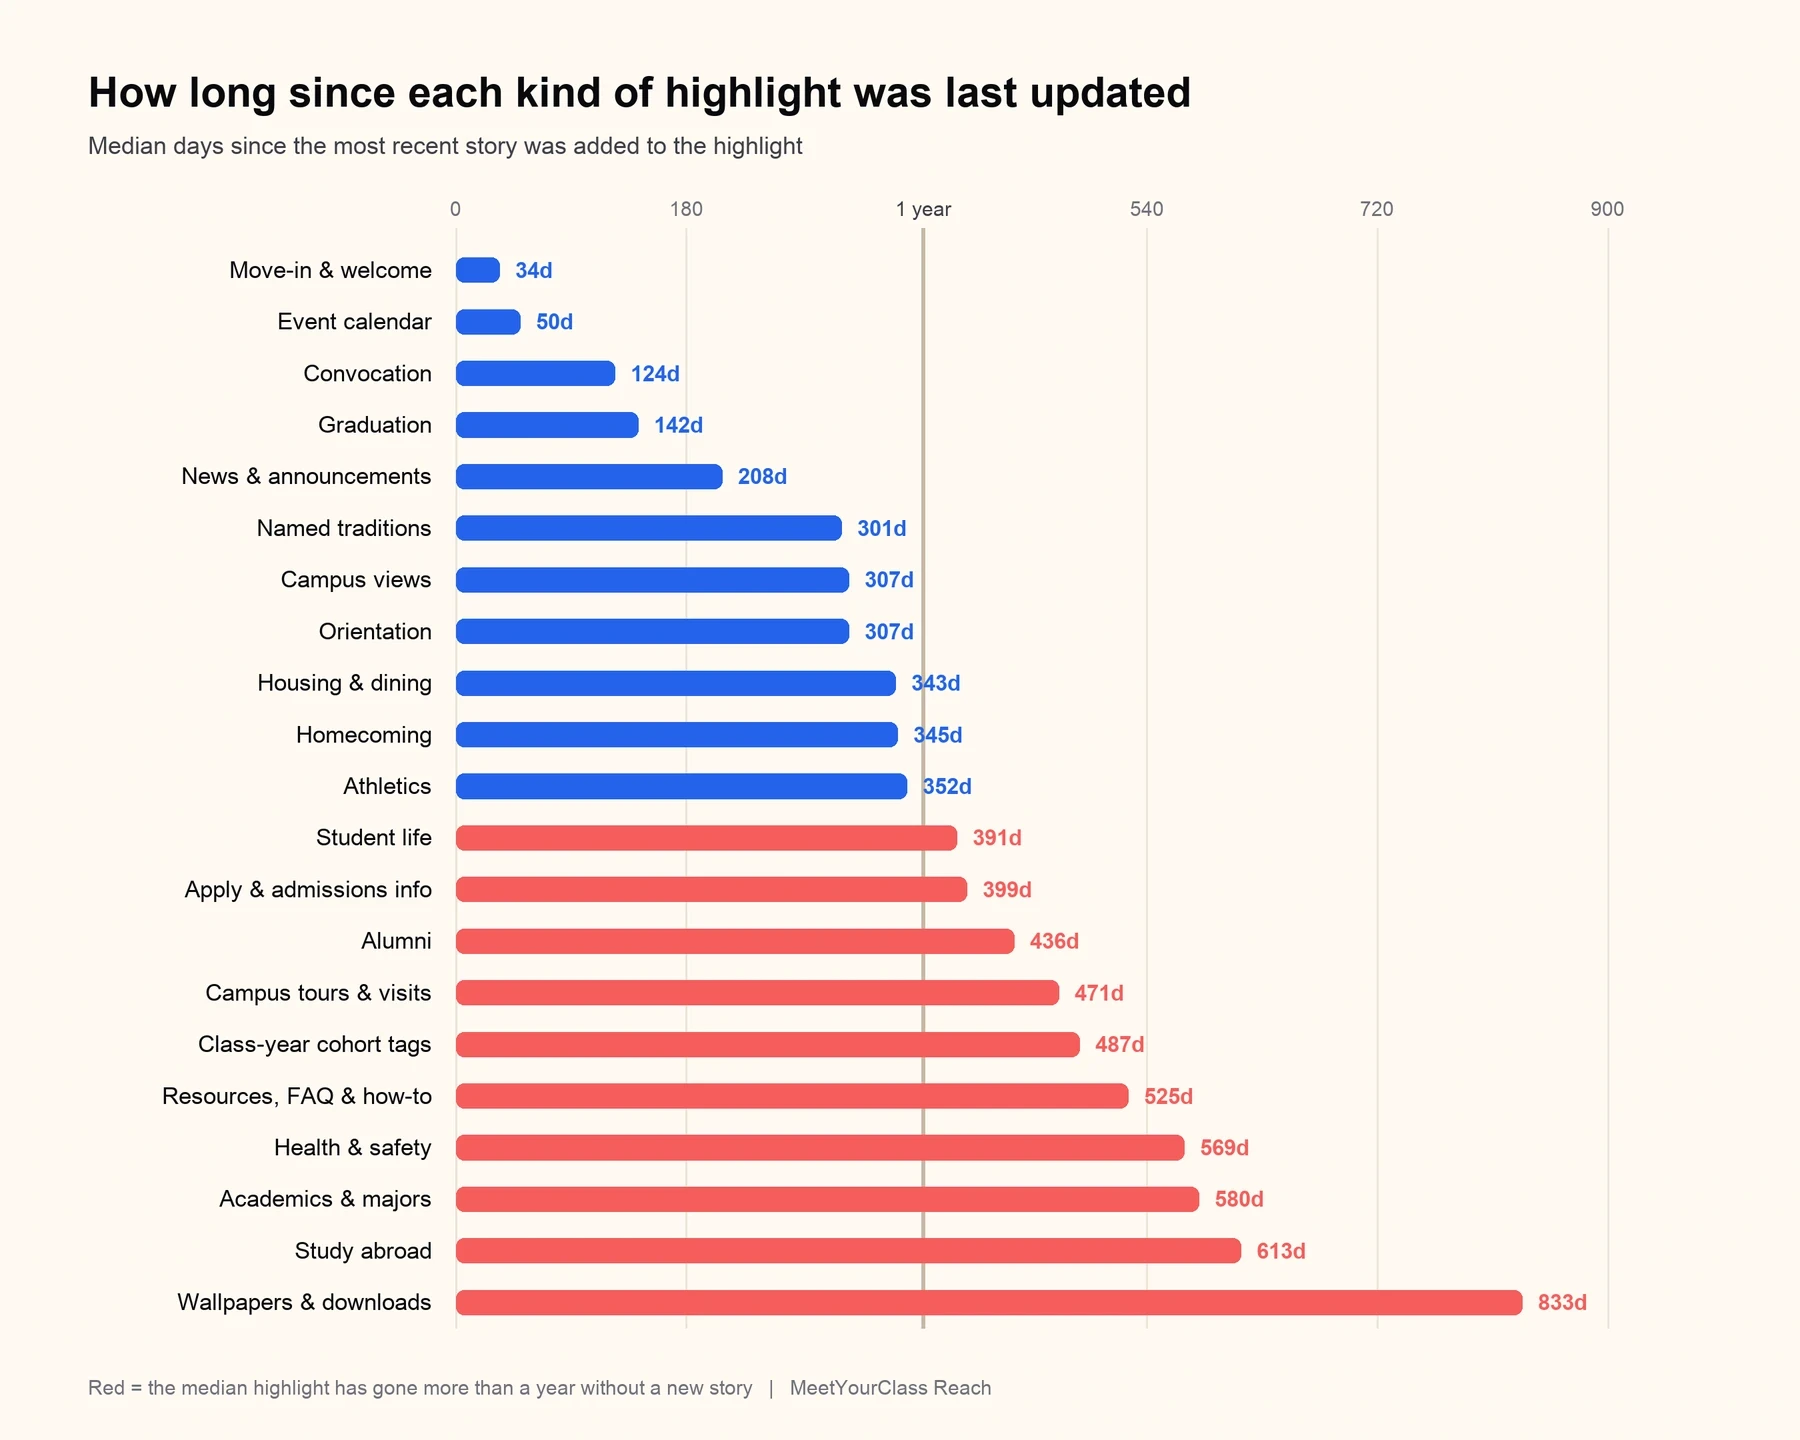
Median days since the most recent story was added, by category.
Study abroad is the starkest case. A genuine 128 day build followed by nearly three years of silence. Health and safety highlights show the same fingerprint, an 8 day span and 750 days idle, because most of them are COVID era artifacts nobody has taken down.
The average profile is showing content four years old
Across whole profiles, the median school last added to a highlight 46 days ago, but the mean is 194 days. Most schools are reasonably current and a dormant tail drags the average. 17.7% have not added anything in over a year, and 7.6% have not in two.
At the other end, these shelves run deep. The median school's oldest visible story is 4 years old, and 37% still display content five or more years old. Only 10% keep a shelf that reaches back less than a year.
The typical profile is a three year archive, fed about six weeks ago, showing a 17 year old a version of campus from 2022.
Three in four covers have no text on them
We analyzed 2,857 distinct cover images.
Cover style | Share |
|---|---|
Flat graphic, icon on solid color | 52% |
Illustration or mixed | 31% |
Photograph | 17% |
Just 25% of covers carry any text. Three in four put the whole explanatory burden on a one word title under a 60 pixel circle.
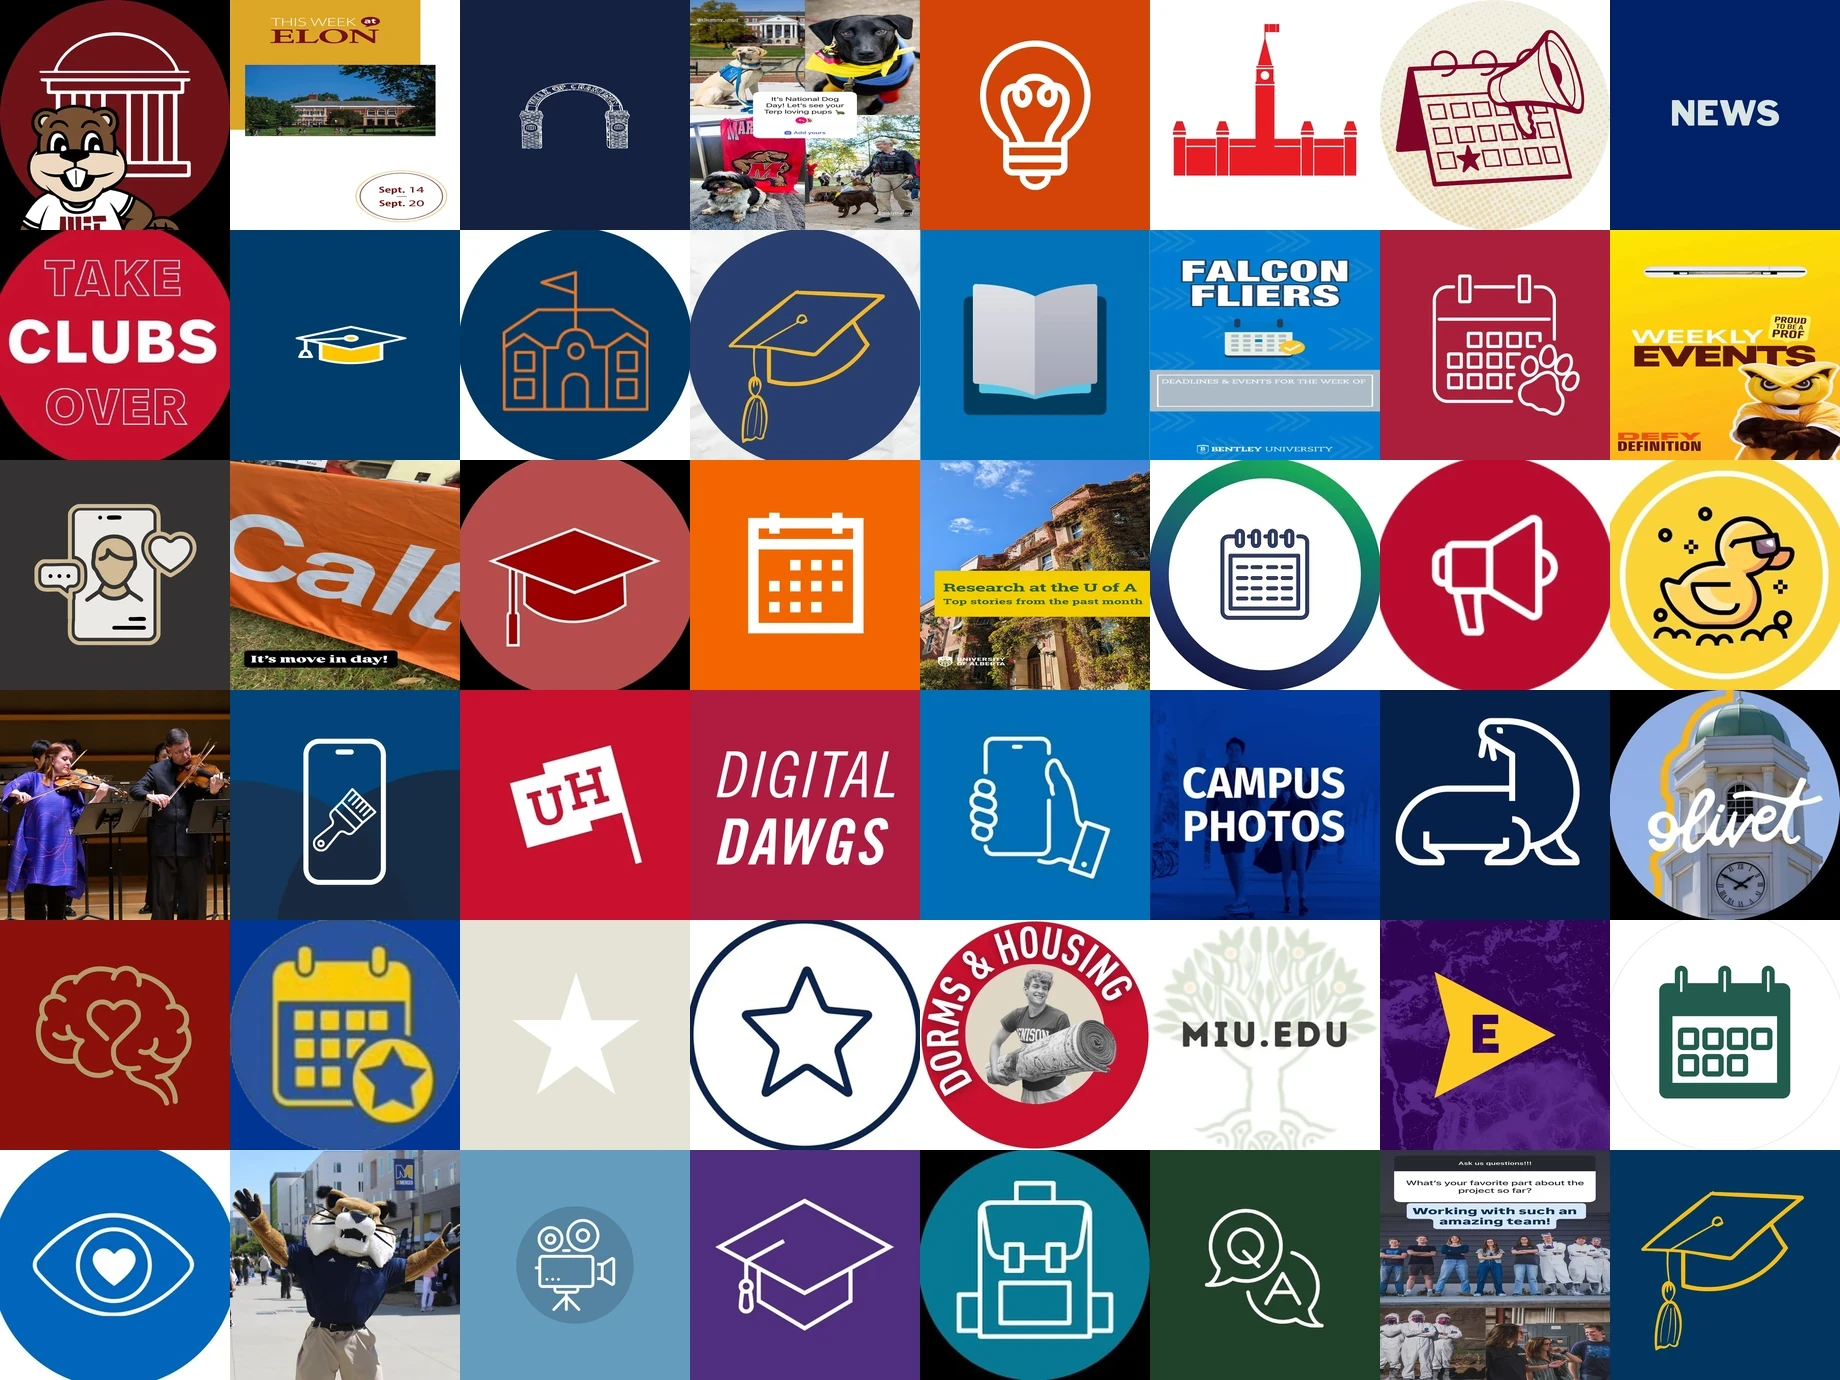
48 covers, one per school, sampled at random from the cohort.
The dominant convention is a white line art icon centered on a solid brand color. A mortarboard for graduation, a calendar for events, a megaphone for news. The calendar icon recurs more than any other single mark. Dominant colors are school colors rather than Instagram's, with blue at 26%, white and grey at 17%, and institutional red at 15%.
Utility highlights are the most designed. Wallpapers are 72% flat graphics, research 66%, resources 63%. Graduation is the most photographic at 26%, the one place schools let a real human face onto the shelf.
One detail for anyone using emoji as titles. Harvard labels its highlights 🔬, 🏫, 👋 and 🚶♀️. Read the words printed on the cover images and they turn out to say something completely different. RESEARCH. ON CAMPUS. MEET HARVARD. And the one nobody would ever guess, HARVARD YARD TOUR.
Harvard has a campus tour highlight. You cannot tell from the title, and neither can a search engine, a screen reader, or a tired high school junior.
What the average school looks like
Put every median together and you get a specific picture. Seven highlights. Six from the genre set, one named in campus dialect. Flat covers, white line icon, brand color, no text.
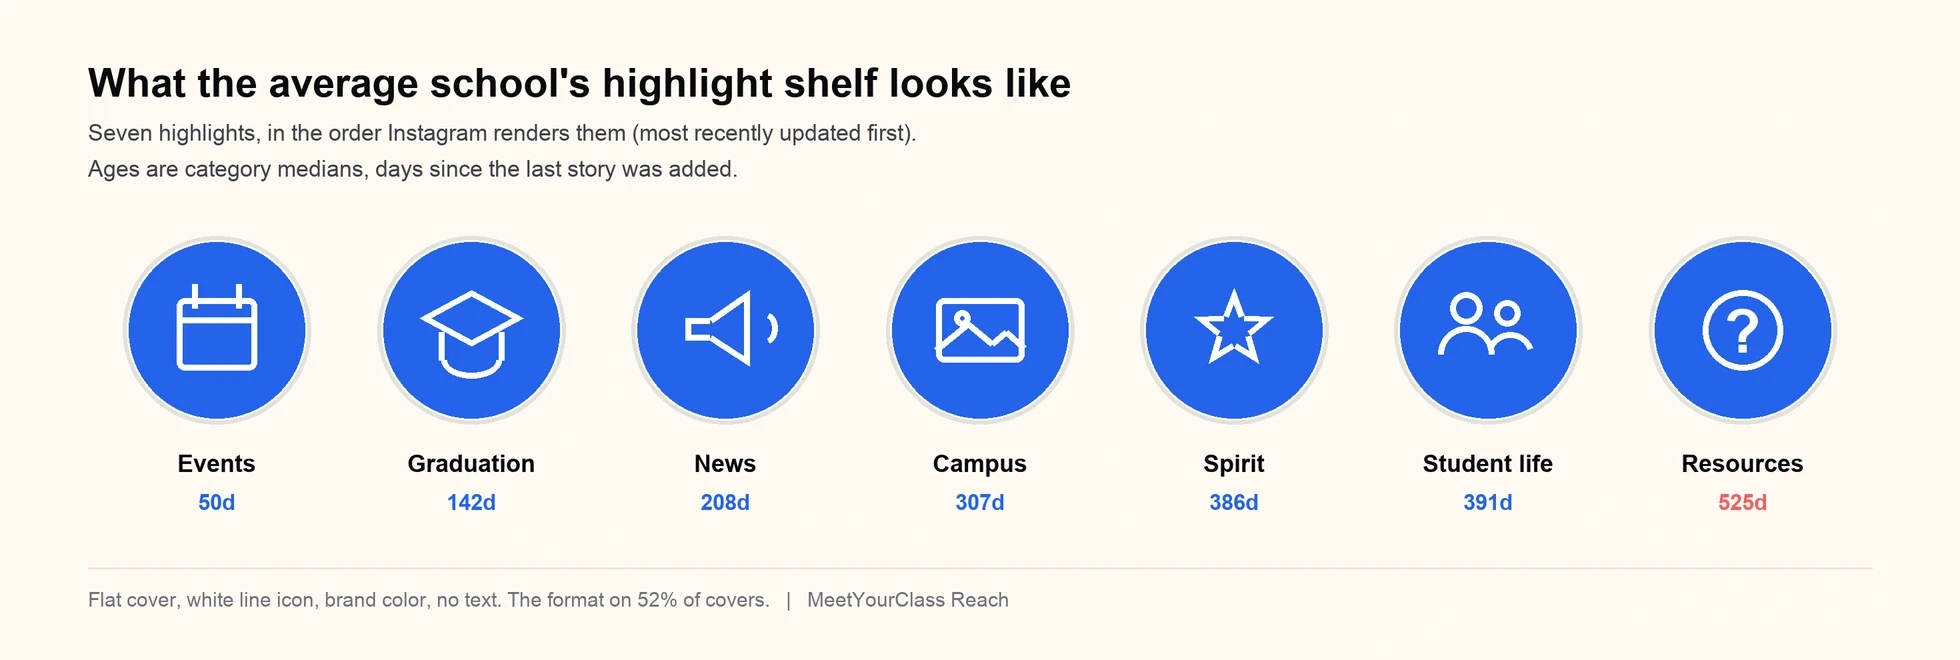
The composite shelf, in the order Instagram would render it.
That profile talks fluently about what happened this week and what happened at graduation. It mentions student life and the view from the quad. It keeps one highlight only current students can decode. And it puts the highlight a prospective student actually needs, the one about visiting and applying, dead last and 525 days cold.
What We Think It Should Look Like
Here is the same seven slots, rebuilt three times a year so the front of the profile matches whoever is actually looking at it.
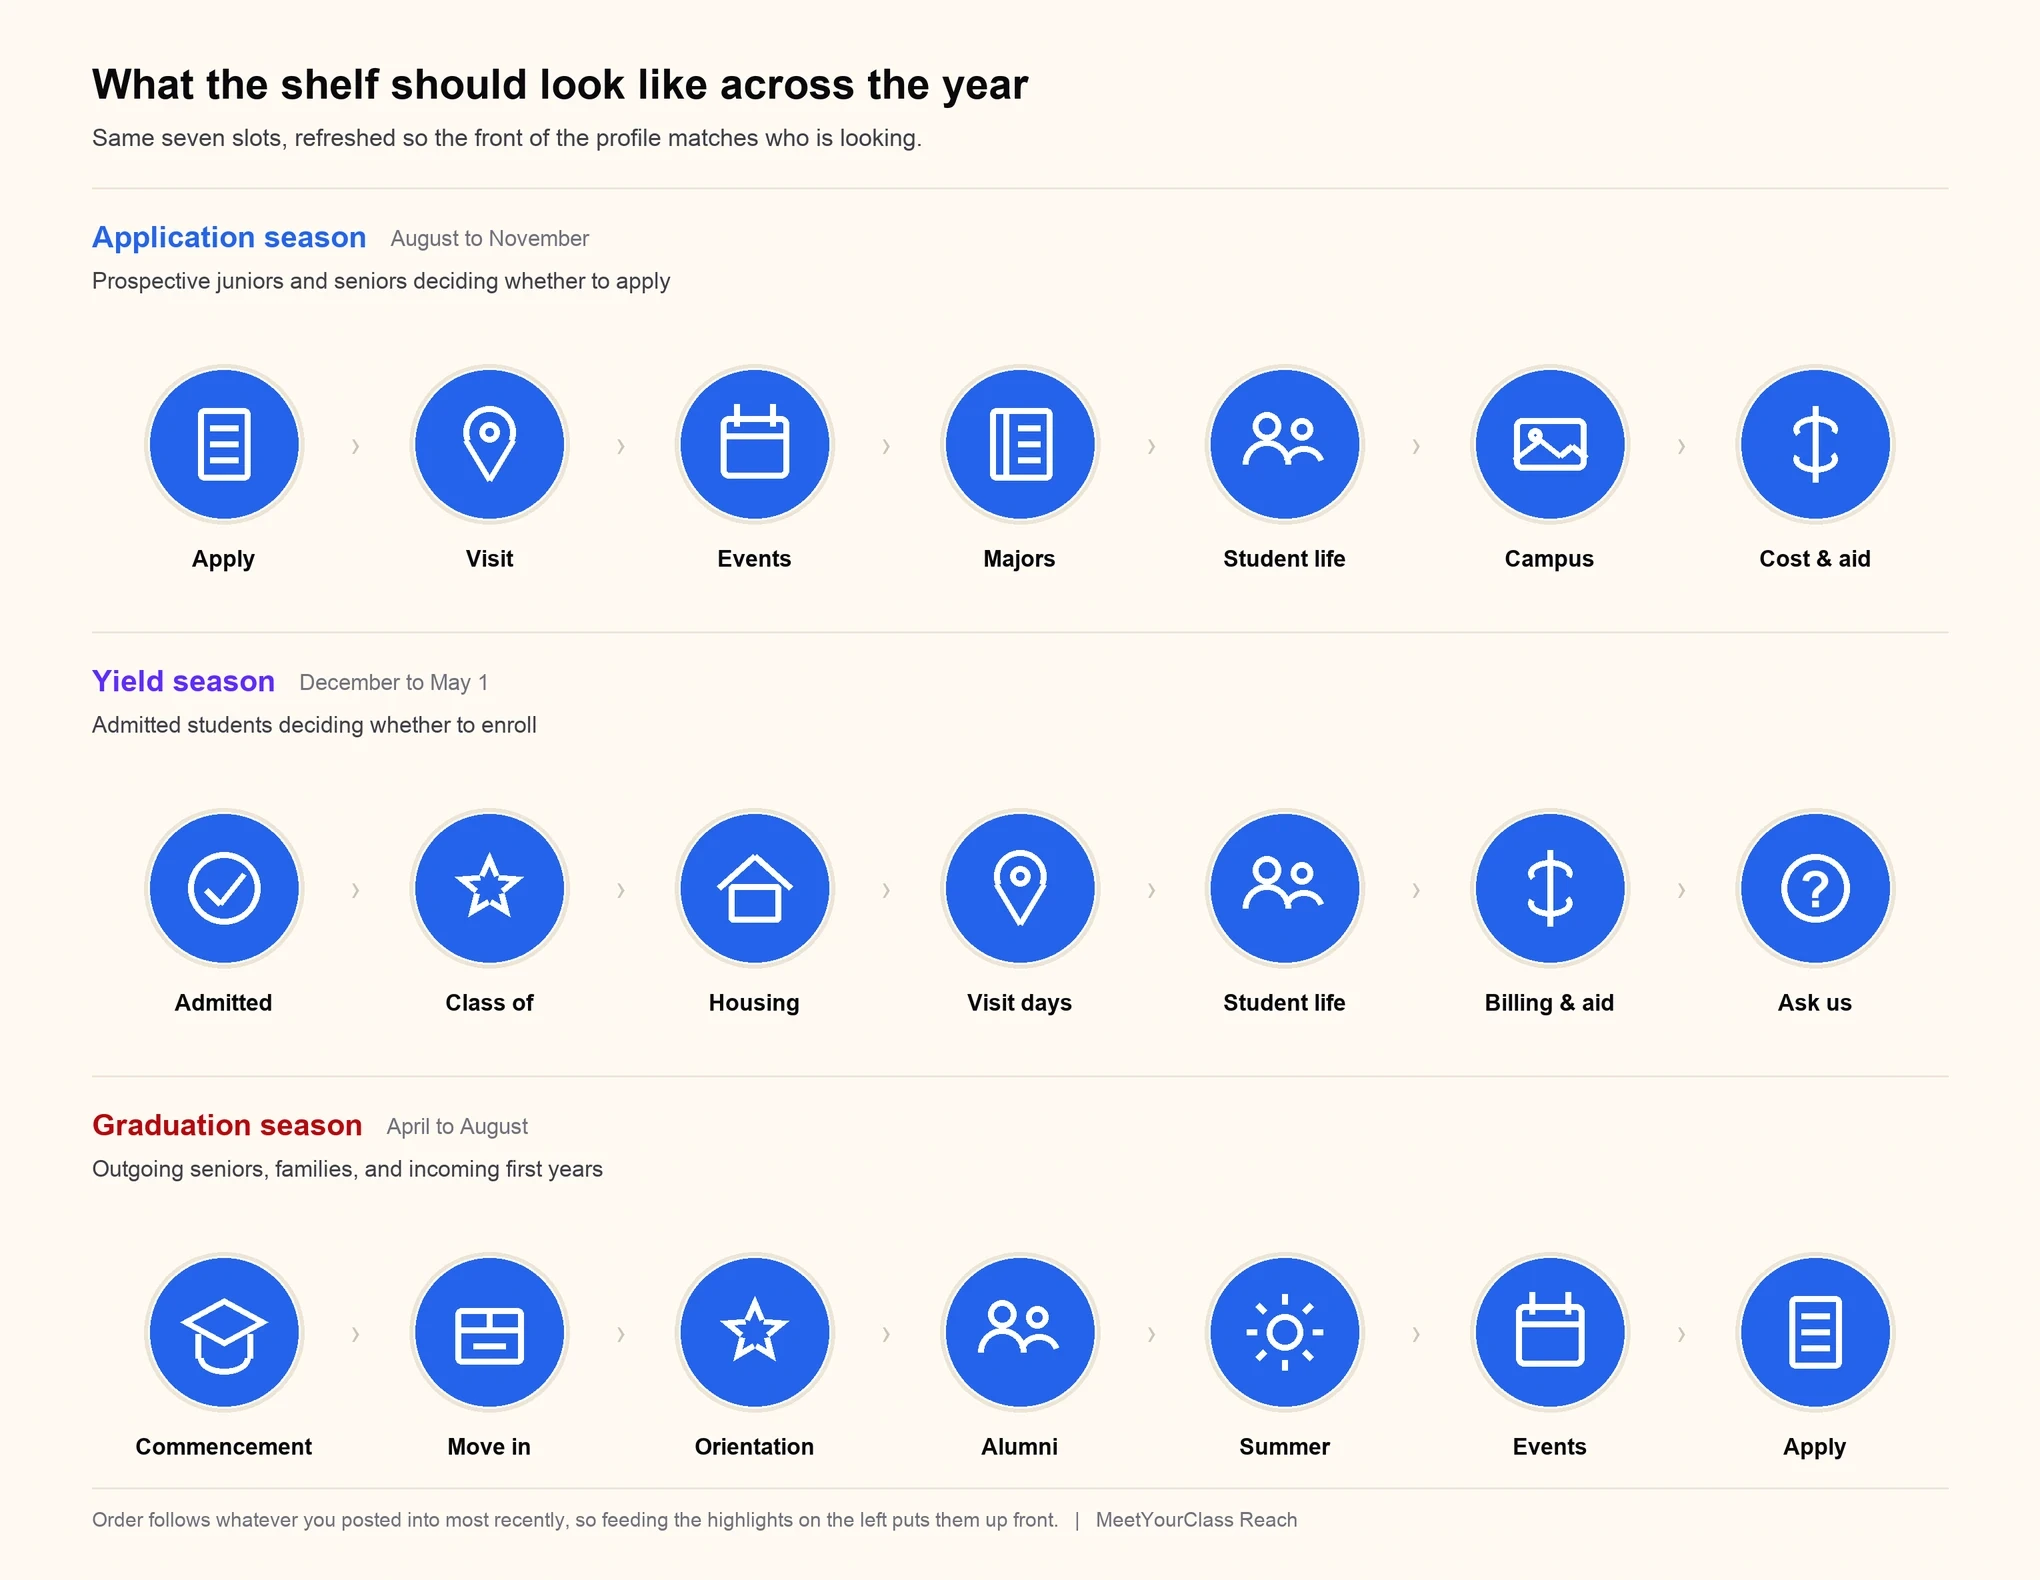
Three seasonal shelves. Order follows whatever you posted into most recently.
Application season, roughly August to November. The audience is juniors and seniors deciding whether to apply. Apply and Visit lead, because those are the two actions you want, and Events sits third because it is the proof that campus is alive. Majors, student life, campus and cost round it out. This is the shelf almost nobody runs. Apply is on 11.8% of profiles and Visit on 10.8%.
Yield season, roughly December to May 1. The audience flips completely. These are admitted students choosing between you and two other schools. Admitted and the class of cohort tag lead, then the things that decide it for a family, housing, admitted student visit days, what daily life is like, and what it costs. Ask us at the end, because this is the group with the most questions. Right now class year cohort tags get three days of attention and then 484 days of silence, which means they go quiet in the exact window they were built for.
Graduation season, roughly April to August. Commencement leads, and that is the one thing higher ed already does well. But the audience is splitting. Outgoing seniors and their families want the ceremony, while a brand new group of admitted students is getting ready to arrive, so Move in and Orientation follow right behind it. Apply moves to the back until August, when the cycle starts again.
None of this requires deleting anything or making new highlights. It is the same shelf, refreshed in a different order, three times a year.
What This Means
Every social manager in higher ed knows you cannot drag highlights into whatever order you want. They sort by most recently updated. What the data shows is that almost nobody is using that.
If order follows recency, then posting one story into a highlight is a free and instant way to move it to the front of your profile. It is the only control the format gives you. It costs a single story. And it is sitting unused at the exact moment it matters most.
Some schools are already doing this by accident. Move in sits third on the average shelf at 31 days idle, because we pulled this data in September and schools had just run move in. Nobody planned that. They posted move in content in August because move in was happening, and Instagram pushed it to the front for the six weeks when incoming families were looking hardest. The events calendar behaves the same way, 52 days idle and second on the shelf.
That is the whole playbook, visible in the two categories that happen to get fed.
Right now the highlights that should be leading a college profile are applying, visiting and events. Common App opened in August. Early deadlines land November 1. The people tapping your profile this month are deciding whether to apply to you. And the apply highlight sits fourth on the 12% of profiles that have one, with a median of 344 days since anyone touched it.
So the strategy is three things.
Use the lever. Post one story into your apply and visit highlights this week. They move toward the front automatically, during the weeks that decision is being made. Roughly one school in twenty currently has an application highlight in their first three.
Refresh instead of rebuilding. The healthy categories are healthy because schools return to the same highlight every cycle rather than starting a new one. That habit is the entire difference between 52 days idle and 344. Apply and visit should be rotated the same way, every fall.
Make the shelf seasonal on purpose. Apply and visit in the fall. Admitted student content in the spring. Move in and orientation in August. Graduation in May. You are not reordering anything. You are feeding whichever highlight matches the moment, and the order takes care of itself.
Two smaller fixes are worth the ten minutes. Write cover labels a stranger can read, since only a quarter of covers have any text and 63% of schools have at least one highlight named in campus shorthand. And audit for age, because more than a third of schools are displaying content five or more years old and there is probably a COVID resources highlight on your profile right now.
Methodology
We selected the 500 highest follower Instagram accounts of type main from MeetYourClass's Reach database, ranging from 3.3M followers down to about 27k. 434 keep at least one Story Highlight and 66 keep none, which we confirmed against the public profile view rather than treating an empty result as an absence.
Highlight inventories were collected with two independent pulls of profiles.
Order semantics were verified rather than assumed. The sort key each highlight carries is exactly the negative of its last updated timestamp. Idle is measured from that last updated value, which matches the newest story in a highlight to within a median of 0.08 days across 1,945 cross checked highlights. Active span is measured from story level timestamps, oldest story to newest, across the 2,432 highlights where we hold them.
Cover art was analyzed with local Tesseract OCR plus edge density and palette measures to separate flat graphics from photographs. OCR reads designed label covers reliably and returns caption noise on photographic ones, so cover text was accepted as a label only when short and word like.
Categories were assigned by an ordered keyword rule table, first match wins. The campus specific residual, 1,040 distinct one off names, is genuine ambiguity rather than unprocessed data.
—
MeetYourClass is social media infrastructure for institutions. Enroll runs the peer communities campuses have on social and turns them into enrollment intent data for admissions teams. Reach is our social media management solution for research, publishing and reporting, and the source of the benchmarking behind studies like this one.


