
Community
on social media:
higher yield,
lower melt
A meta analysis looking at how MeetYourClass impacted the enrollment of our partners throughout the Fall 2026 admissions cycle
Who’s included
Every MeetYourClass partner without exclusion
Reporting
All results in aggregate
Period
September 2025 to August 2026
Method
Participation matched to each school’s CRM records
Key Findings
This case study looks at results across all MeetYourClass partners throughout the Fall 2026 admissions cycle. Data points are based on all information provided by our partners; while reporting parameters varied by institution, all available data was utilized without exclusion.
Participation: Verified to individual CRM records, an estimated
2 in 3 enrolled studentsparticipated in their school’s MeetYourClass community. Around half of these students participated before depositing, typically five weeks earlier.
Level of engagement: These students typically had about
80 touchpointswith their MeetYourClass community. A single introduction post also went a long way: students who chose to be featured on Instagram gained a median of49 new connections.
Early signals: 55% of the time, our alert that a student had committed elsewhere came before the school recorded the withdrawal. And 23% of the time, our alert that a student had committed to the school came before the school recorded the deposit.
Enrollment impact: Admitted students who joined before depositing
enrolled at 3.4x the rate against all admitted students. Depositors in the community melted at 65% lower of a rate than depositors outside it.
Background
At MeetYourClass, we believe universities that build community early are at a serious advantage in yielding students. In our 2027 College Decision Playbook, we asked students when they first tried to connect with other prospective students online, whether to find a roommate, meet people from their hometown, or see who else would be in their major. A shocking 49% tried to meet their class before committing, and 86% before they moved in. If a school only brings its admits together at in-person events like admitted student days or orientation, students who want to connect sooner will find community at the other colleges on their list first, and grow more attached to those schools.
That attachment matters because the people are a big part of the decision. 63% of the students we surveyed said a school’s sense of community and belonging was a major factor in where they enrolled. A student who makes a friend or finds a roommate before move-in starts to feel committed to the school, while one who feels isolated over the summer remains at high risk of melting. It’s why MeetYourClass was founded: our founding team met as high school seniors through an Instagram page for admits at the University of Michigan.
That’s also why we don’t stop at our app. We build every community on Instagram too, and that side is especially important to us because it’s where students already are. Social media is quickly becoming the center of the college search: 76% of students used social media to build their college list, more than any other source, including university websites. And on Instagram, joining a community only takes one tap of the follow button.
How students used MeetYourClass
For each partner, we ran two connected spaces for its incoming class:
1.
An Instagram page, like @udayton2030, worked as a virtual yearbook for the class. Admitted students sent in photos and an introduction about themselves: things like where they're from, their plans for campus, why they chose the school, and whether they still needed a roommate. We posted each introduction on the Instagram page so students could find each other and start messaging.
2.
The MeetYourClass app gave each school a private space built around group chats and a searchable student directory. Students could look up classmates by everything from hometown and major to personal hobbies and roommate preferences, with searches like “psychology majors from Chicago who are night owls."
Our team white-gloved the management of both spaces day-to-day, handling approvals, moderation, and communications from admission through move-in.


Instagram page
An Instagram account for each partner’s incoming class. Students sent in photos and an intro, and we posted each one as a feature.
Students found it on their own, with little or no promotion
Official and school-branded, so students trusted it
Nurtured students every time they opened Instagram


MeetYourClass app
A private community where students searched for classmates by major, hometown, and interests, then joined their school’s group chats.
Also a website, so students could join without a download
Over 1 million students have signed up
Configured to each partner’s community goals
Participation
Matched to individual CRM records, an estimated two in three enrolled students participated in their school’s MeetYourClass community, which is a conservative count. We only counted students we could tie to a record in the school’s CRM, so it leaves out Instagram followers with ambiguous usernames and students who signed up with different details than the school had on file.
Participation is generally a mid- to late-funnel activity: most students look to meet their class once a school becomes a real option. Nevertheless, much of the participation happened while students were still deciding. 45% of community members who deposited began participating before their deposit, typicall about five weeks earlier. Those weeks before the deposit are the hot window, when students are making up their minds. By May 1, 81% of enrolled community members had already engaged.
The vast majority of this activity was organic. Most partners preferred to keep MeetYourClass as a a student-led space. So while many included MeetYourClass as an item on their admitted-student checklist and in the occasional drip campaign, the Instagram page did much of the work to make students aware of the community and to draw them in.
Level of engagement
Once students joined, they kept coming back. The typical enrolled member had about 80 touchpoints across the MeetYourClass app and Instagram, most of them from seeing classmates’ introductions on Instagram. For our partners, that’s about 80 moments when a prospective student pictured themselves on campus, and none of them needed an email from the admissions office. They also stayed: 95% of enrolled students who followed the Instagram page never unfollowed it, and 42% of enrolled members were still active on our app throughout the summer melt window from June through August.
Posting a student’s introduction on the Instagram page went a remarkably long way. After their post went up, students gained a median of 49 new connections, all on Instagram: people who followed them, and who they followed back. That’s 49 people a student was connected to before move-in, from a single post.
One post, a network before move-in
Mutual follows a student gained after we posted their introduction


How our partners used MeetYourClass
Our partners used MeetYourClass in three ways: they acted on the data it produced, reached students inside the community, and brought more of their admitted students into it.
1. Using data from the MeetYourClass app & Instagram page
Throughout the cycle, MeetYourClass turned student activity into real-time enrollment signals – delivered both through our admin dashboard and also through direct CRM integrations. The data told admissions teams everything from who to reach out to, to how sure they could be about each student enrolling, to which other universities were in play.
What the data included
Partners received four kinds of data on their students:
Commitment alerts
Each student landed in one of three groups, and alerts named the school when a student committed elsewhere.
Committed to the school
Committed elsewhere
Not committed yet
Cross-apps
Every other college community a student joined on MeetYourClass, which showed partners their real competition. Commitment alerts covered those schools too, so partners knew when a student committed to one of them.
Activity
Here are a few examples of the activity partners saw for each student:
On Instagram
Followed or unfollowed the Instagram page
Named a college in their personal Instagram bio
Clicked links through the page
Commented on its posts
On MeetYourClass
Joined or left the community, and the reason they gave
Bookmarked the school
Updated their status, from researching to committed
Opened the app, and how often
Traits
A student’s intended major, the profile tags they picked, and the bio they wrote. Partners could customize the tags and add their own sign-up questions, and the answers showed which types of students were yielding at higher rates.
🌟 First-Generation Student
🏠 Looking for a Roommate
🐓 Early Bird
🎣 Fishing
🥇 Student Athlete
🌏 Studying Abroad
☕ Grabbing Coffee
🧗 Climbing
🏛️ Rushing a Fraternity/Sorority
🧹 Neat Freak
🦉 Night Owl
📸 Photography
🕸️ Spikeball
🔑 Living in Dorms
🛍️ Thrifting
🧊 Always Cold
Where the data came from
The data came from two places:
The MeetYourClass app, where students set their status from researching to committed, joined communities, and filled out their profiles.
The Instagram page and personal profiles, where social listening picked up bios that named a college, plus follows and unfollows of the Instagram page, even for students who never joined the MeetYourClass app.
Commitment alerts drew on both:
Two signals behind a commitment
What a student selected in the app, and what their public Instagram bio said
In the MeetYourClass app
Researching
Haven’t applied yet
Applied
Waiting to hear back
Accepted
Got in, still exploring options

Committed
100% going
On Instagram

Because a student can commit to only one school on MeetYourClass, a commitment is a clearer read than a deposit. In our Playbook survey, 18% of students who paid a deposit paid more than one, but when students mark themselves committed, that status matches where they enroll 94% of the time.
Partners could also send us data from their CRM. That was optional, but it improved what came back:
Matching: partners sent each admitted student’s name, email, phone number, birthday, and CRM ID, and we used those details to find the student on MeetYourClass and among the Instagram page’s followers.
Without a CRM integration: partners only received data on students who joined their community and marked themselves as applied, admitted, or committed.
With a CRM integration: we could confirm which Instagram followers were admitted students and find admitted students across our entire MeetYourClass database, including students who had an account but never joined the partner’s community. That greatly expanded the number of commitment alerts partners received.
Deposit and withdrawal status: when partners sent these too, our alerts could flag where a student’s signals disagreed with the school’s records.
How partners used the data
Partners could work from the data in our admin dashboard or in their own CRM, which received a fresh file every week through a direct integration with whichever system they used. Most teams started by sorting students into the three commitment groups:
Committed to the school: the surest yield. Before May 1, one team called every committed student who hadn’t deposited yet.
Committed elsewhere: students to plan around. One team sent a final message to those who had gone quiet, then took them out of its fall projections, so its forecast reflected who was actually coming.
Not committed yet: still winnable, with their cross-apps showing which colleges a counselor was up against.
The alerts also gave counselors a head start, often reaching partners before the school’s own records did:
Our alerts often came first
Share of commitment alerts that reached partners before the school’s own record
Students who later withdrew
55%
Students who later deposited
23%
Knowing who to call is half the job. The other half is knowing what to say, and the data covered that too: the tags each student picked, the other colleges they were weighing, and what they had done on the Instagram page and in the app.
Tags also let partners reach whole groups at once. One large public university invited every student who tagged fishing to a meet-and-greet during welcome week.
2. Marketing within the community
The Instagram pages reached far beyond the admitted class. As students shared their introduction posts, the pages drew an astronomical 2,100 organic views for every enrolled student, with no paid promotion. Views this high were uniquely possible because the community was built on an app already used by 3 billion people every month. The pages were public, and when we featured a student, we could add them as a collaborator, so the post also appeared on their own profile and in their followers’ feeds. Students often shared the post to their story too, putting it in front of their entire following.
How one post reached the people closest to a student
A featured student’s introduction, posted with her as a collaborator and shared to her own story


Those followers were the people closest to each student: family, friends, neighbors, etc. That is part of what made the Instagram page such a unique marketing channel: partner content reached the admitted students who followed the page and the people around them. Counted month by month, the pages reached about 140 additional Instagram accounts for every enrolled student.
The calculator below uses those averages to estimate, for a class of any size, an Instagram page’s organic views, the accounts it could reach, and what the same views would cost in Instagram ads.
Posts on these Instagram pages were consistently seen by about 75% of their followers, and the pages carried a far higher concentration of prospective students than a school’s main Instagram account. Partners used that attention to reach admitted students where they already were.
Story highlights on one partner’s Instagram page
Each one opened to a resource the school wanted in front of its admitted students

Visit

Campus Life

Events

Financial Aid

Orientation

Housing
Common resources partners promoted through the community included:
Campus visits and virtual tours
Admitted student days and open houses
Scholarships and financial aid
The FAFSA and net price calculators
Deposit deadlines and next steps
Admissions portals and to-do lists
Meetings with an admissions counselor
Orientation registration
Housing and residence life
Clubs and student organizations
Campus life, from athletics to wellness
Majors and academic programs
Reach
New for Fall 2027
Reach wasn’t released until after the Fall 2026 cycle, so it isn’t part of these results. This cycle, partners are also using it to fill their Instagram pages with day-in-the-life videos, student takeovers, and event recaps.


54% of students
said takeovers boosted their interest

Student workers
One workspace to fully manage creating and posting content.

Community forms
Fill the feed with photos and videos from students.

Student takeovers
Students post to the Instagram page, with no passwords handed out.
3. Bringing more students into the community
Communities like our Instagram pages sometimes form on social media without the school’s involvement, but a school cannot realistically point students to a channel it doesn’t control, promote it as a benefit, or mention it in official communications. Our partners could do all three, and that was one of the main benefits of MeetYourClass – simply having an official channel.
A few pieces of one partner’s marketing kit
From the current kit, with each piece pointing admitted students to the Instagram page and the app
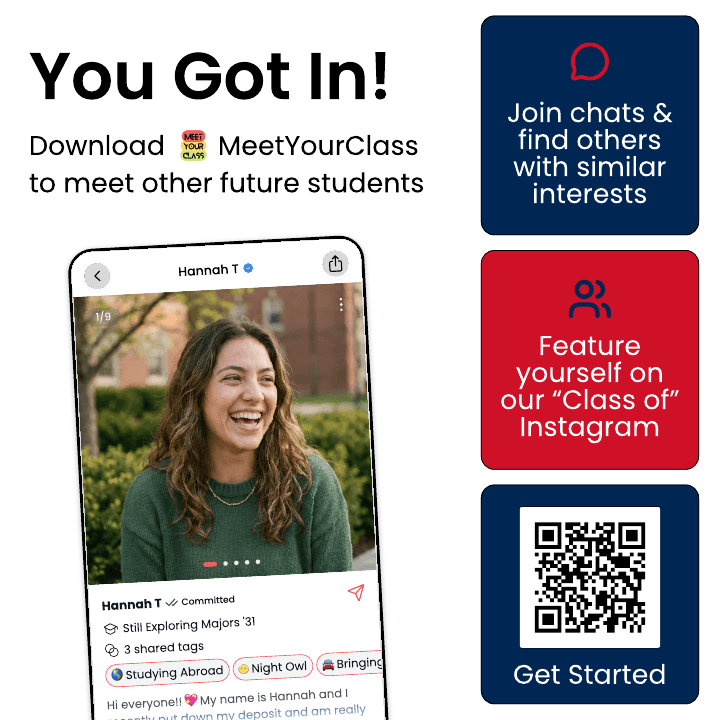
Admit package insert

Instagram post

Email and checklist graphic

Welcome center poster
We see joining a prospective student community as a new enrollment milestone, potentially as important as visiting campus, completing the FAFSA, or paying the deposit (Source). As the enrollment results in the section below show, students simply being in the community was powerful on its own, even if a given partner didn’t take full advantage of our data or the marketing potential.
Enrollment impact
All of this came together where it counts most: in the enrolled class. Students in the community were better connected and more engaged with their incoming class, and our partners had a clearer picture of where each of them stood and what they needed.
Community members enrolled at higher rates and melted less
Enrollment and melt rates, averaged across partners


Enrollment rates come from partners whose deposit records also cover students who later withdrew.
The improvements in enrollment outcomes was consistent across partners, and neither result was limited to the most active students. When we broke down the results by how students engaged with the community, from following the Instagram page to being featured on it, every group enrolled at a higher rate and melted less.
At every level of engagement, students enrolled at about five times the overall rate
Admitted students grouped by how they engaged with the community. A student can count in more than one group.
67%
4.9×
65% reduction
60%
5.2×
65% reduction
52%
5.2×
65% reduction
38%
5.8×
66% reduction
27%
5.9×
65% reduction
Each level runs above the 3.4× in the figure above because it also counts students who engaged after depositing. Melt compares depositors in each group with depositors outside it at the same schools.
The simplest step stood out. Following the Instagram page only takes a few seconds, yet students who followed it enrolled at 5.2 times the rate of all admitted students, close to the 5.8 times for students who created a comprehensive MeetYourClass profile. One follow kept the school in their feed for the rest of the cycle. That is why we built the community around the platform students already use: the first step asked very little of them.
Students who already lean toward a school are more likely to join its community, so these figures can’t isolate how much of the gap MeetYourClass caused. That is also what makes participation so valuable: it shows counselors, months before classes start, who is likely to enroll, and just as important, who isn’t engaging and needs outreach.
Methodology
Who’s included: The results cover fall 2026 entering classes at public and private partner universities in seven states, which admitted anywhere from about 1,500 to more than 20,000 students. We report all results in aggregate.
CRM matching: We matched each student’s activity to the school’s CRM records to confirm whether they were admitted, deposited, and enrolled. The participation estimate also accounts for Instagram followers whose names didn’t match exactly.
What “participated” means: A student participated if they followed the Instagram account, joined the app community, or added the school to their college list on MeetYourClass. In a manual review, 38.6% of the followers we could clearly identify as admitted students used names that didn’t exactly match their CRM records, so we adjusted the matched Instagram-only count once to account for them.
Levels of engagement: A student can count in more than one level. “Participated in the community” uses the definition above. “Joined the community” counts students who joined in the app or followed the Instagram page, and “Followed the Instagram page” includes students who later unfollowed. “Created a comprehensive MeetYourClass profile” counts students whose profile was approved for the school’s community in the app, and “Featured on the Instagram page” counts students whose introduction we posted.
Timing: We treat the school’s recorded deposit date as the decision point, so “before depositing” means a student started participating on an earlier calendar day.
Touchpoints: Each count adds a student’s app visits anywhere on MeetYourClass to their estimated views of the student introductions posted on the school’s Instagram account while they followed it. We assume a 75% view rate on Instagram and leave out other types of posts.
Views and reach: Our monthly Instagram snapshots cover September 2025 through August 2026, with none for March 2026, so recorded views undercount the full year. The calculator multiplies the average views and accounts reached per enrolled student by your class size. Equivalent ad spend uses Birch’s Instagram advertising-cost benchmark of $20.33 per 1,000 views. Accounts reached adds up each month’s reach from the same snapshots, so an account reached in three different months counts three times.
Averages: Unless we say otherwise, results are averages of each school’s own figures. “Typical” lead times and touchpoint counts are medians across the relevant students. The figure of 49 new Instagram connections averages each school’s median gain among students whose introductions we posted.
Enrollment comparisons: The early-participation comparison only uses partners with deposit dates for both enrolled students and students who later withdrew. The early-participation group includes students who participated before depositing and students who participated but never deposited. The melt comparison looks only at depositors, comparing those who participated with those who didn’t. None of these comparisons separates the effect of participation from students’ existing interest.
Additional enrollment comparisons: Community members were about 11 times as likely to deposit and 12 times as likely to enroll as other admitted students at the same schools. The same caveat applies here: students who are already interested are more likely to participate.
Survey figures: Figures from our 2027 College Decision Playbook come from a survey of 2,876 students in the Fall 2026 incoming class.
Commitment accuracy: The 94% figure compares students’ committed status on MeetYourClass with where they enrolled, from our 2025 enrollment analysis.