Article
20 Social Media Ideas for Colleges That Actually Perform

Running social media for a college means filling a calendar that never quite empties. Part of it is decided for you, the posts other offices need out the door by Friday. The rest is yours, and that is where the real question sits. What should we actually post?
Plenty of lists will hand you ideas. We wanted to know which ones work.
So we went and looked. Over the last twelve months, Reach has indexed 522,407 posts from 5,386 accounts at 2,371 colleges and universities, sorted by the kind of content each one was and how it performed against its platform.
Some of it confirmed what you would expect. Some of it did not. The single highest performing type of post in higher education earns close to double the median engagement rate, and it makes up 0.8% of what institutions publish.
What follows is twenty ideas that hold up in that data, grouped so you can find one that fits the week you are actually in. Each comes with a real example from a real institution and the engagement it earned.
One note before the numbers. All of them are medians rather than averages. Averages on engagement rate get dragged upward by the occasional post that goes enormous, which makes every category look stronger than a normal week feels.
What actually performs
Here are the ten strongest content categories on Instagram, ranked by median engagement rate. The index column shows performance against the platform median of 1.34%, where 100 is average. The share column is what portion of higher ed output each one currently gets.
Category | Index | Median engagement | Share of posts |
|---|---|---|---|
Move in and move out | 194 | 2.60% | 0.8% |
Graduation and commencement | 156 | 2.09% | 4.4% |
Greek life | 153 | 2.04% | 0.2% |
Orientation | 147 | 1.97% | 2.5% |
Nostalgia and throwbacks | 147 | 1.97% | 0.4% |
Memes and comedy | 145 | 1.95% | 1.4% |
Aesthetic campus content | 145 | 1.95% | 2.8% |
Dorm and housing | 138 | 1.85% | 0.4% |
Exams, midterms and finals | 131 | 1.75% | 0.8% |
Campus traditions | 129 | 1.72% | 4.8% |
Read the last two columns together and something stands out. Several of the strongest categories are also among the smallest. Greek life performs 53% above the median on two posts in every thousand. Dorm content and throwbacks sit in the same place, high on performance and low on volume. Those are the easiest gains on this page, because the content is already happening on campus.
This table covers the last twelve months. If you want to know what is working this week rather than what works generally, we publish a live view of higher ed content categories that refreshes daily, with the same breakdown for Facebook and TikTok.
The format matters more than the topic
One finding sits above everything else on this list and it takes a sentence to act on.
Instagram format | Median engagement | Posts analyzed |
|---|---|---|
Carousel | 2.01% | 166,836 |
Video | 1.32% | 118,085 |
Single image | 0.78% | 138,007 |
A carousel earns 2.6 times what a single image earns. Not 10% more. Two and a half times, measured across 166,836 carousels. Single images are still 138,007 posts, roughly a third of everything published to Instagram, at the weakest return of the three formats.
The same holds on Facebook, where carousels return 0.22% against 0.10% for an image and 0.08% for video. If you change one thing after reading this page, add a second slide.
Posts about the place itself
These four work in any week of the year and need nothing more than a phone and access to a building. Prospective students are trying to picture living somewhere, and three of these four categories are among the most underused in the dataset.
1. The residence hall tour
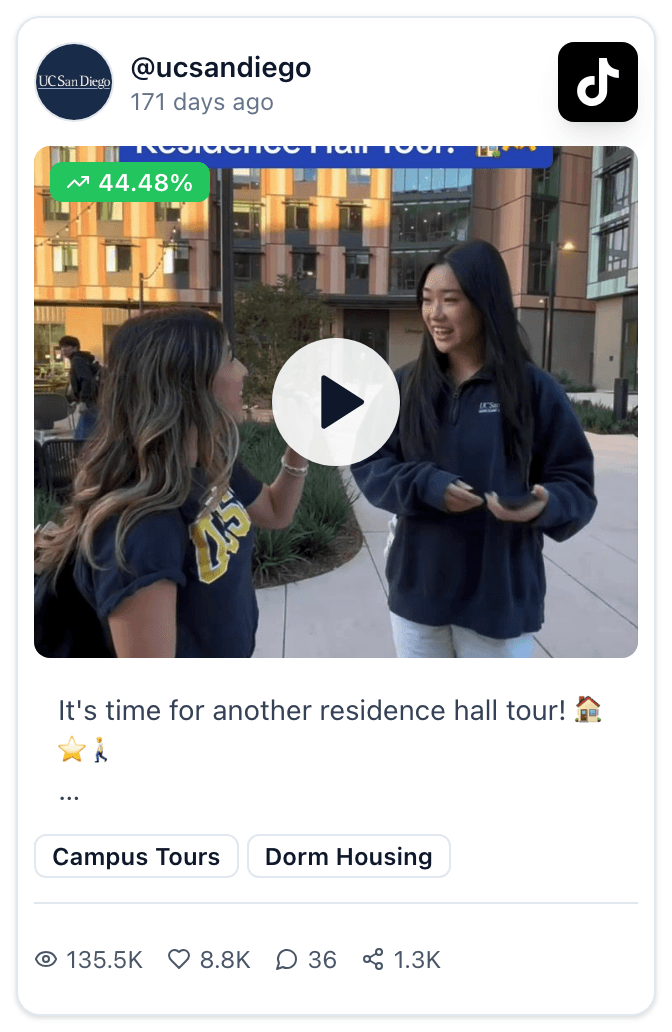
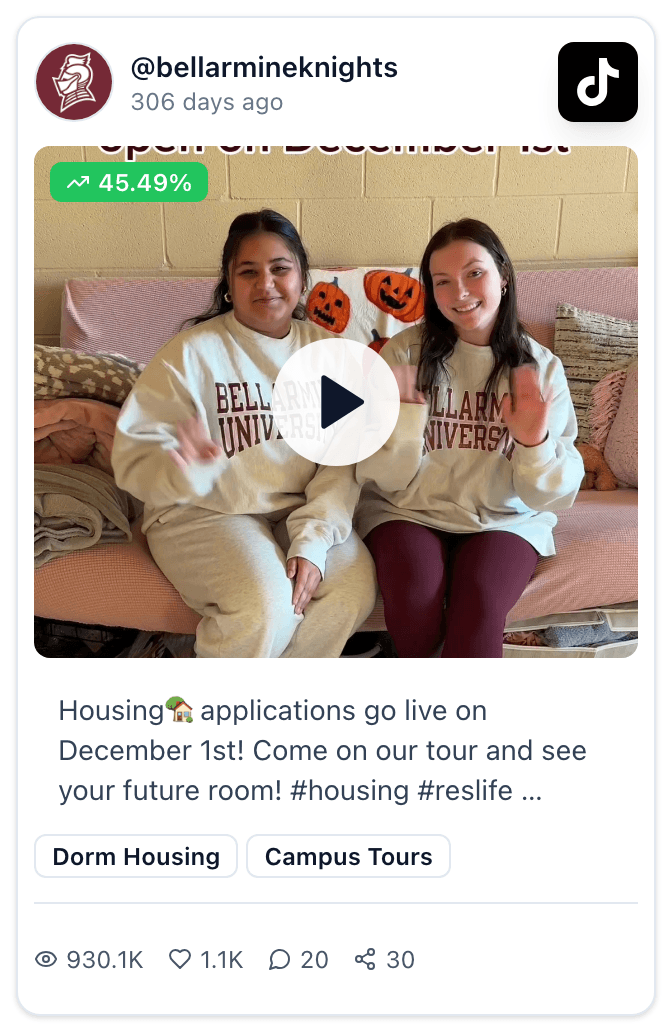
Dorm and housing content is index 138 on 0.4% of output. Four posts in every thousand, for a category that beats the median by 38%.
UC San Diego walks through one neighborhood at a time, captioned "It's time for another residence hall tour." Bellarmine tied theirs to the housing application opening on December 1, which folds a deadline into a tour rather than posting the deadline on its own. One building per post travels further than a full housing tour in a single video.
2. The dorm room check
The other half of the housing story, and students have usually made the content already.
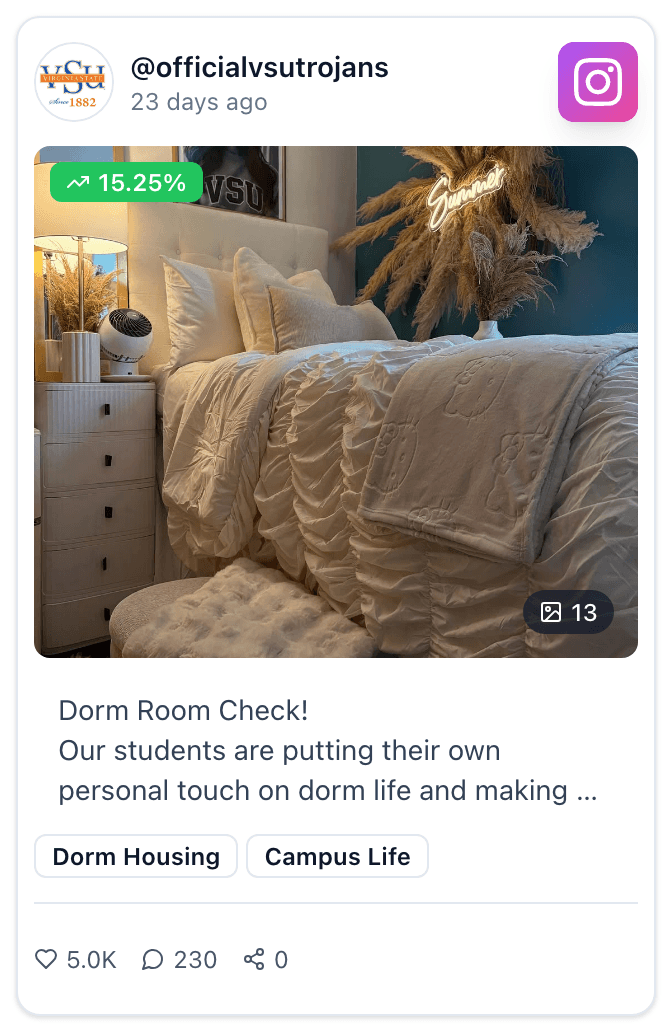
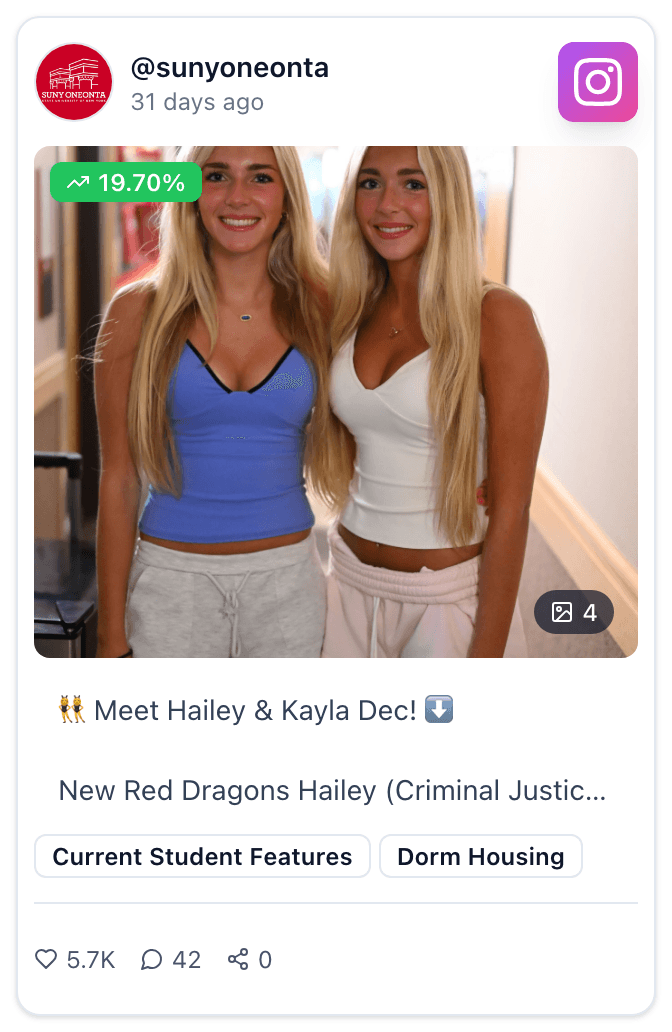
Virginia State ran "Dorm Room Check" showing how students had decorated their own rooms. SUNY Oneonta profiled two roommates on move in day. Ask first and credit the student. Both of those feature rooms as they actually looked.
3. The campus reel with nothing to sell
Aesthetic content is index 145. It carries no message, no call to action and no news, and it outperforms most of what does.
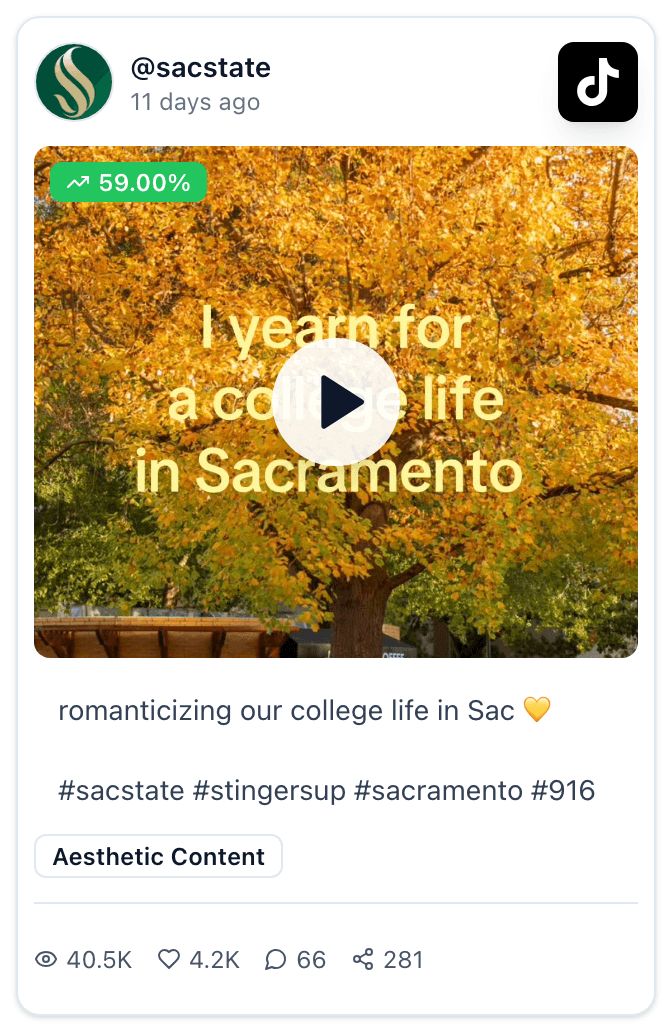
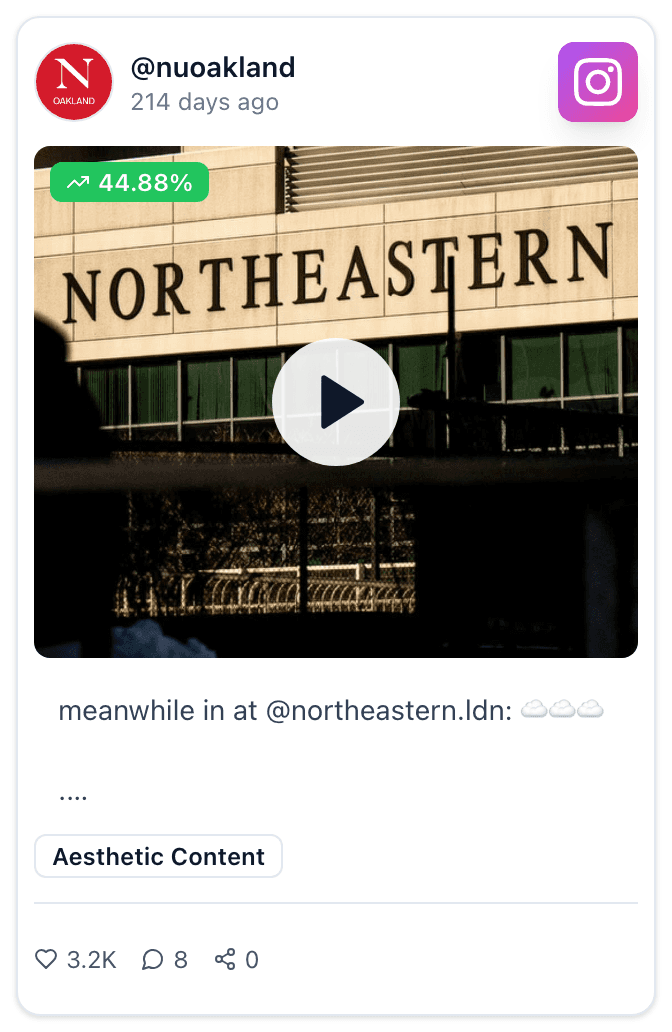
Sacramento State posted a campus montage captioned "romanticizing our college life in Sac." Northeastern's Oakland campus posted one shot of the building against an evening sky, captioned only "meanwhile in at @northeastern.ldn" and three clouds. What these have in common is that the post is the feeling, and the information lives somewhere else.
4. The town, not the campus
Students are choosing a place to live for four years. City and local content is only 0.6% of higher ed output.
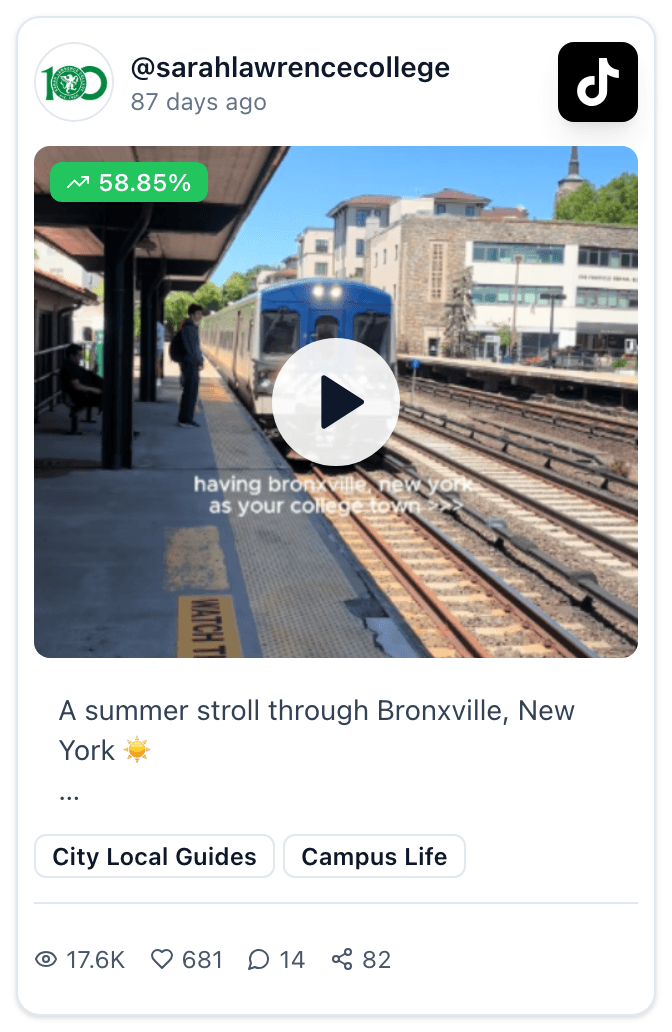
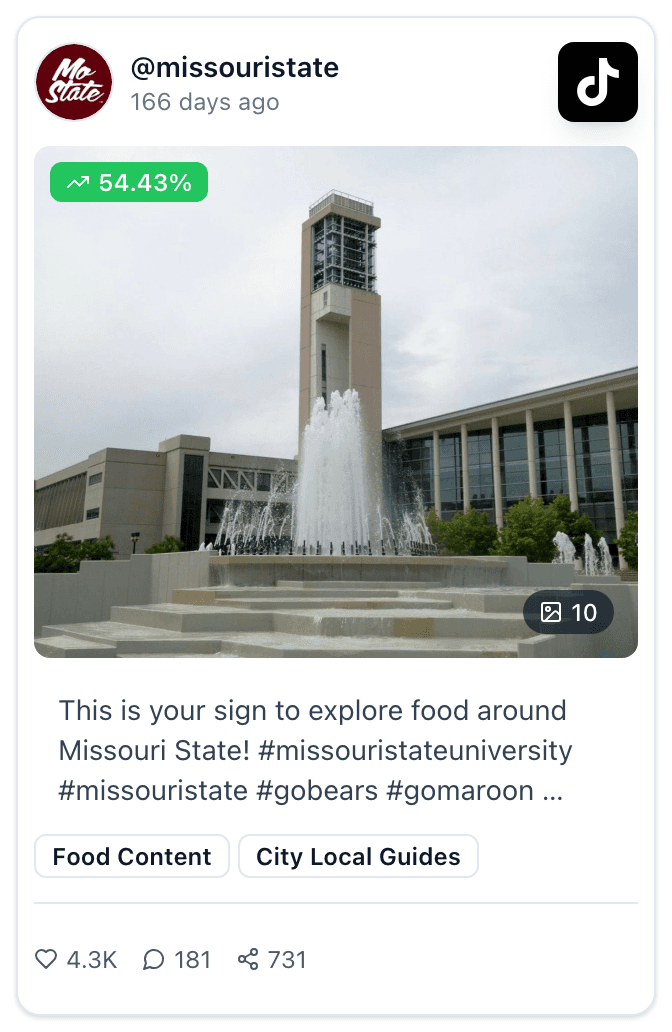
Sarah Lawrence filmed a summer walk through Bronxville and mentioned the thirty minute train into New York. Missouri State ran a food tour of Springfield. This category peaks in July, when students are deciding and campus is quiet.
Posts about people
Student features are already 7.2% of higher ed output and land almost exactly at the median, index 101. So the category is not the differentiator. The four below are the versions that pull above it, and all of them work year round.
5. One question, several students, straight to camera
The strongest student features in the data tend to have a question at the centre rather than a profile, and they come in two sizes.
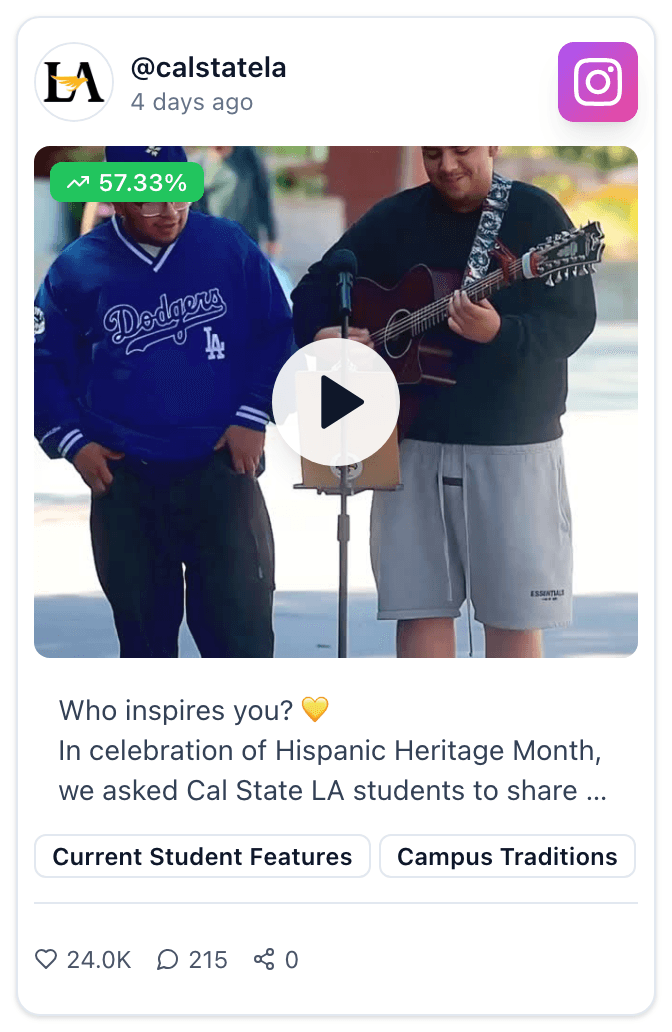
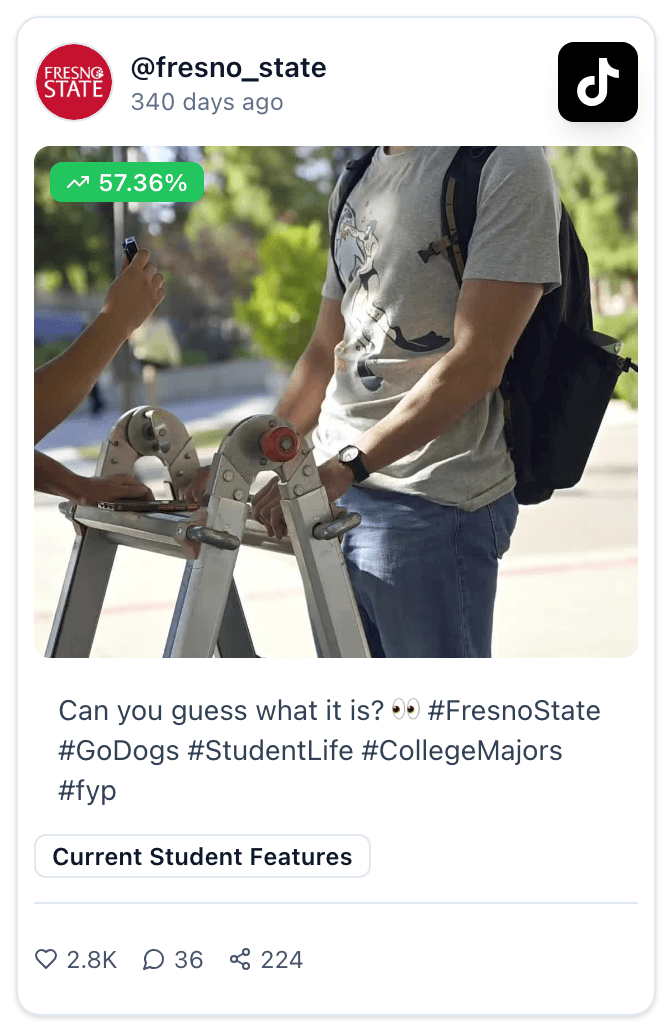
Cal State LA asked students who is a Hispanic person that inspires them, for Hispanic Heritage Month, and earned over 24,000 likes. Fresno State runs the produced version of the same mechanic, a recurring game called Major Ladder where the host gets 90 seconds to guess a student's major, built off the Career Ladder format.
6. The hometown call out
A comment driver that can be quick to make.
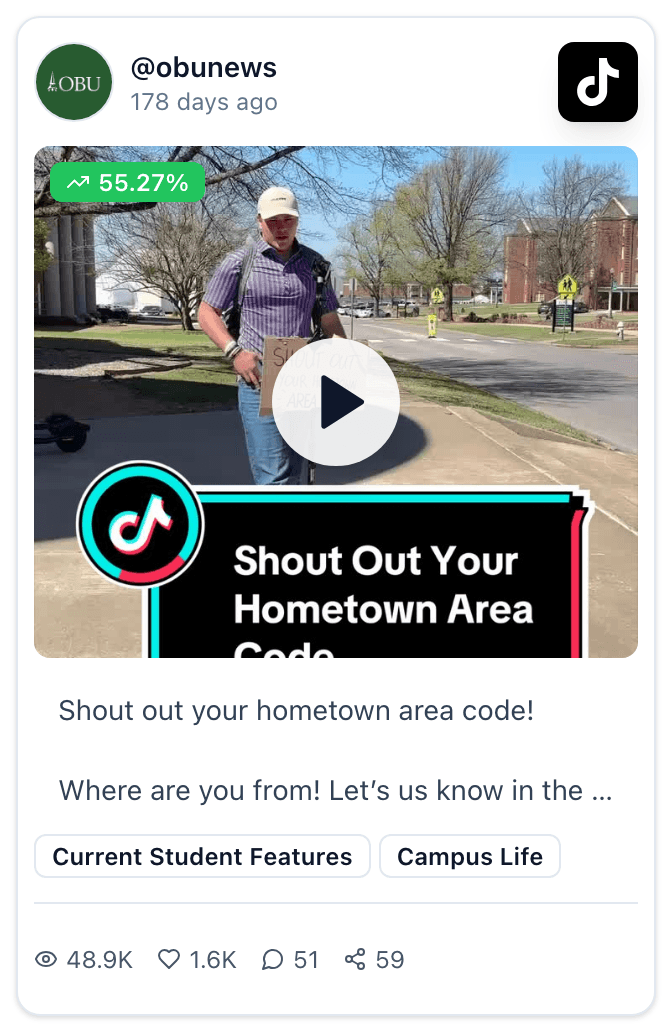
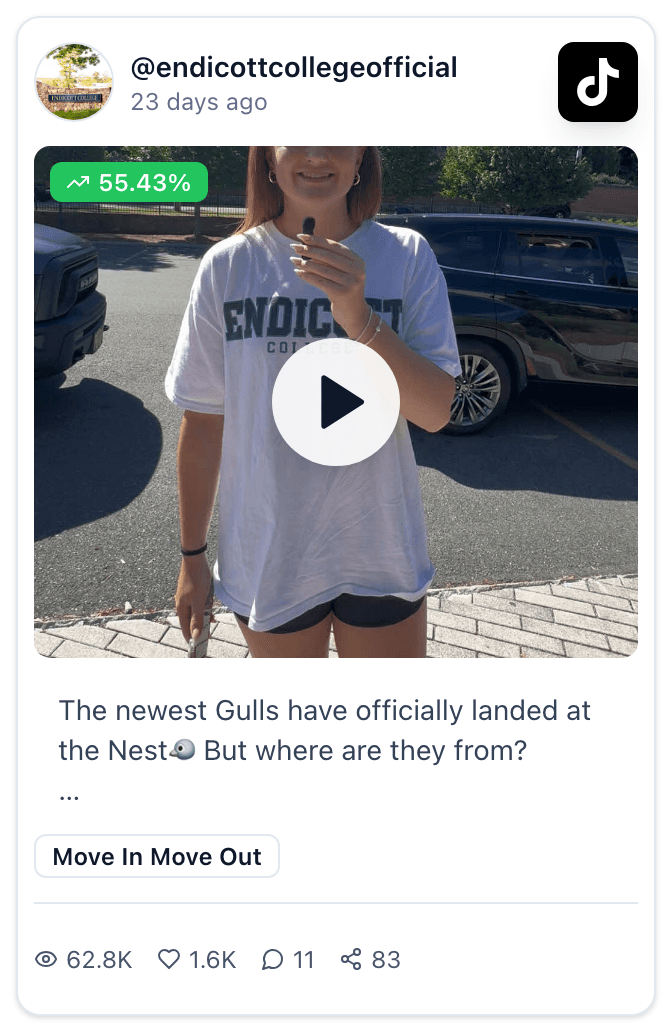
Oklahoma Baptist posted "Shout out your hometown area code! Where are you from?" Endicott mapped where the incoming class came from. The useful part is that the audience answers rather than reacts, and comments are worth more than likes both to the algorithm and to you.
7. The professor post
Faculty and staff features are index 81 on Instagram, below the median. The ones that beat it are not profiles.
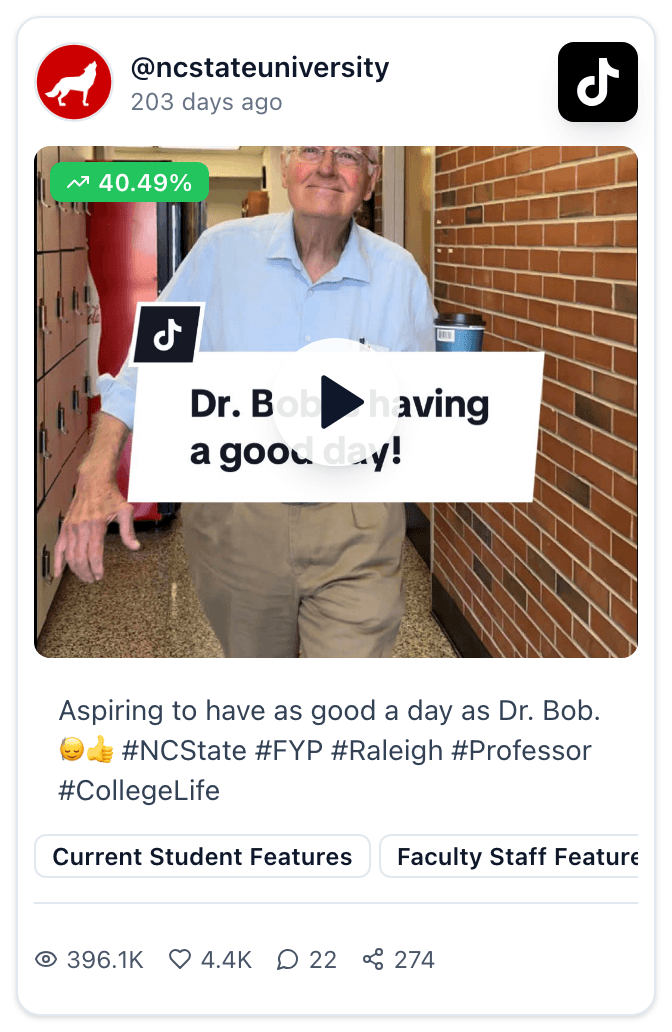
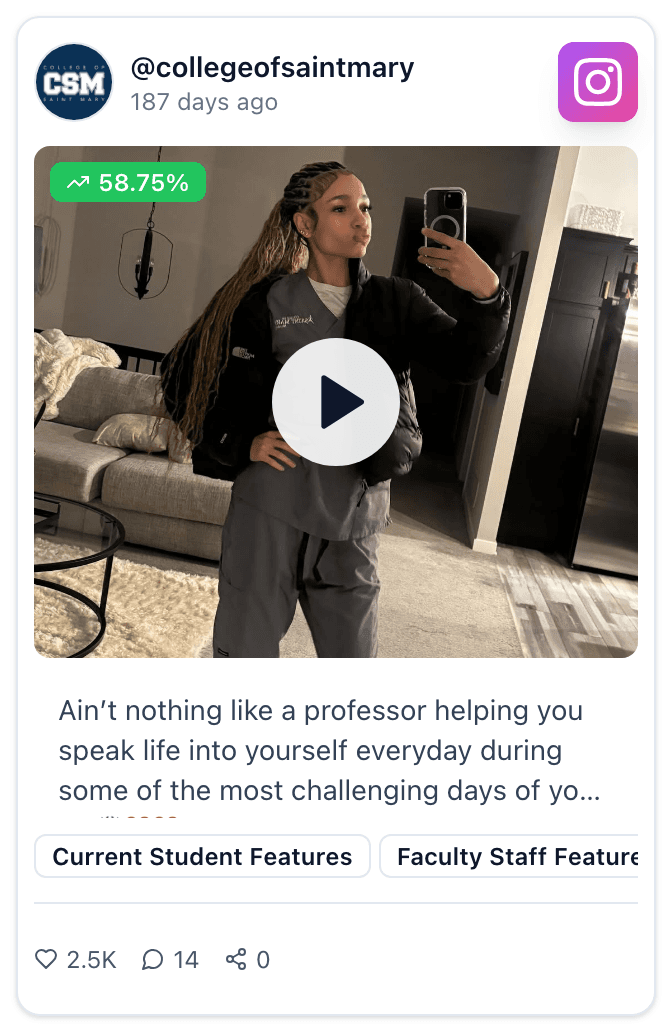
NC State posted a professor going about his day, captioned "Aspiring to have as good a day as Dr. Bob." College of Saint Mary let a student describe what a professor had done for her. In both, somebody other than the institution is doing the talking.
8. The alumni origin story
Alumni features average out at index 77, one of the weaker categories, and yet some of the biggest posts in the dataset are alumni posts. The gap is between a career update and a story.
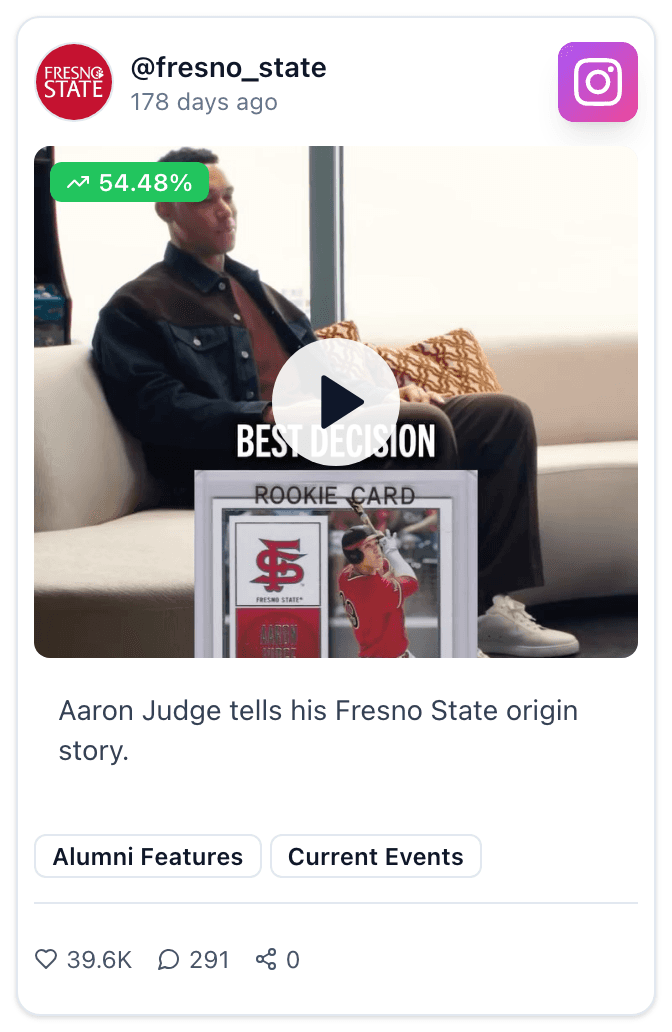
Fresno State posted Aaron Judge telling his own Fresno State origin story, earning 39,631 likes. St. Mary's College of Maryland gave the account over to an alum who came back twenty years after their own commencement to deliver the commencement address, written in the first person. Alumni content peaks in June, though neither of these needed a particular month.

Posts that are funny or familiar
Memes and comedy are index 145 on 1.4% of output. Nostalgia is index 147 on 0.4%. Both sit near the top of the performance ranking and near the bottom of the volume one.
9. The in joke only your campus gets
The humour that performs best in this data is rarely a trending format. It is usually something that would not make sense at another institution.
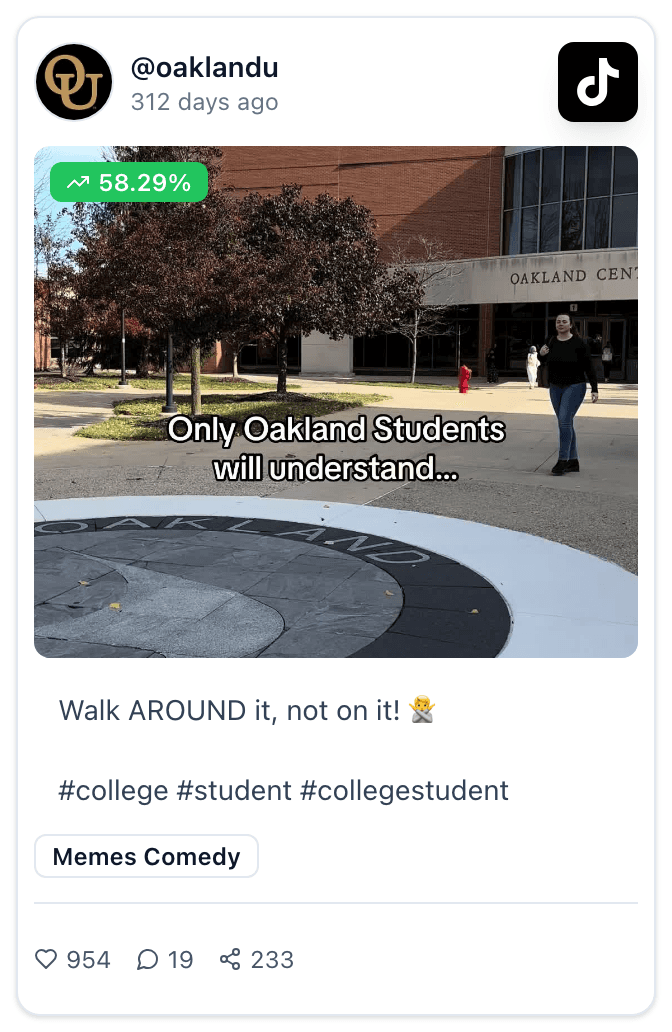
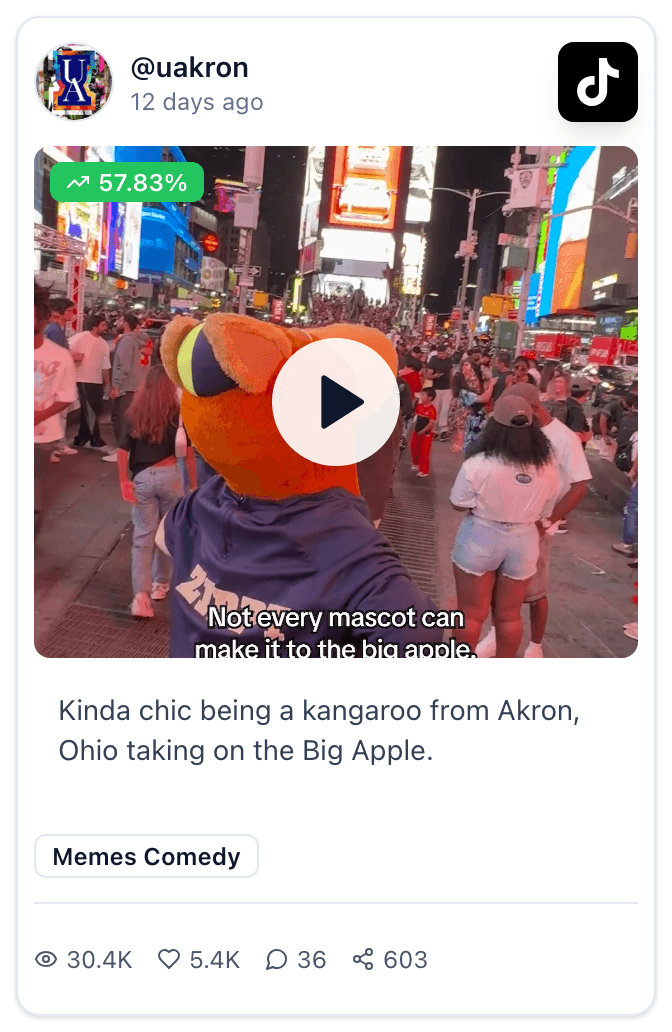
Oakland University posted "Walk AROUND it, not on it" about their campus seal. Akron leaned into being "a kangaroo from Akron, Ohio taking on the Big Apple." Narrower tends to beat broader here, because the joke is a membership test and the audience is the campus.
10. Weather as an event
Free content that arrives several times a year, and the campus is already talking about it.
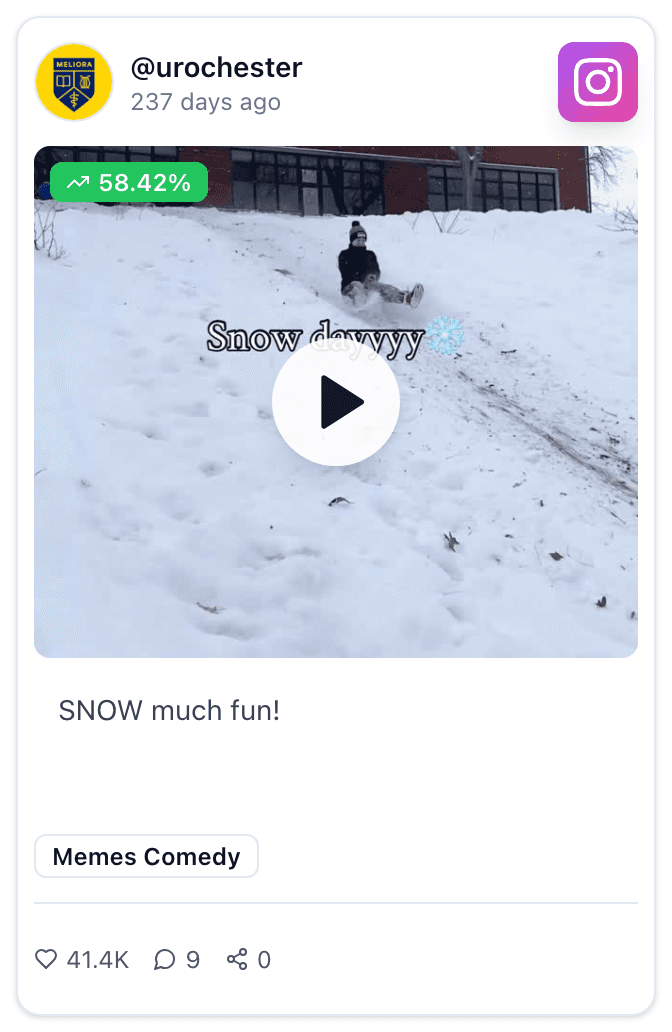
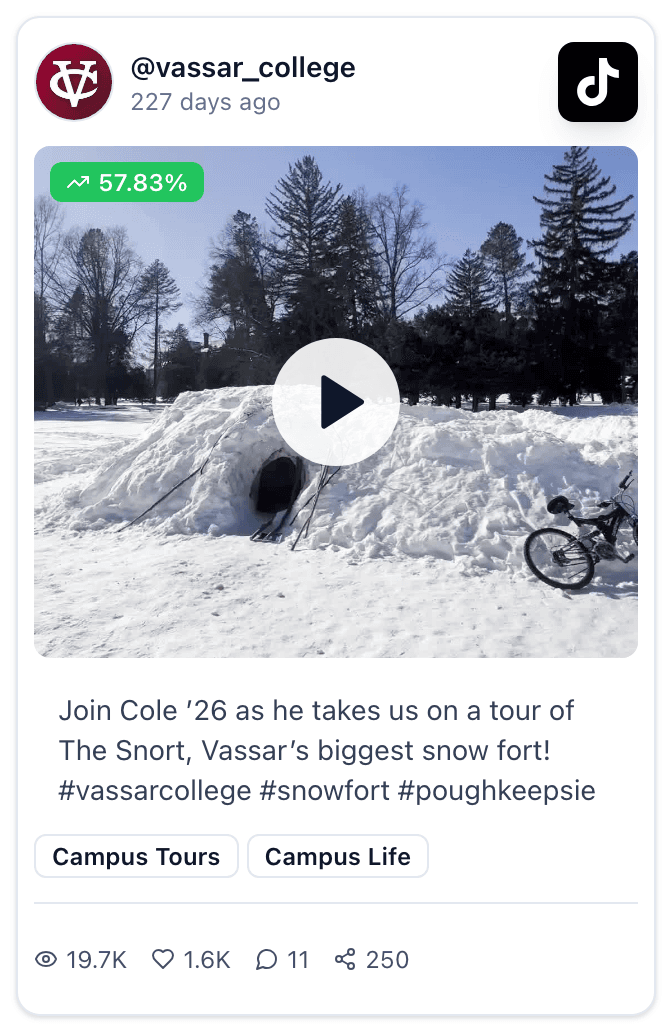
Rochester posted "SNOW much fun" and earned 41,418 likes. Vassar sent a student to tour the biggest snow fort on campus. The one requirement is speed. This works on the day and not the week after.
11. The tradition explained by someone who runs it
Campus traditions are index 129 on 4.8% of output, one of the few strong categories that already gets real volume. Handing the explanation to a person seems to be what lifts it.
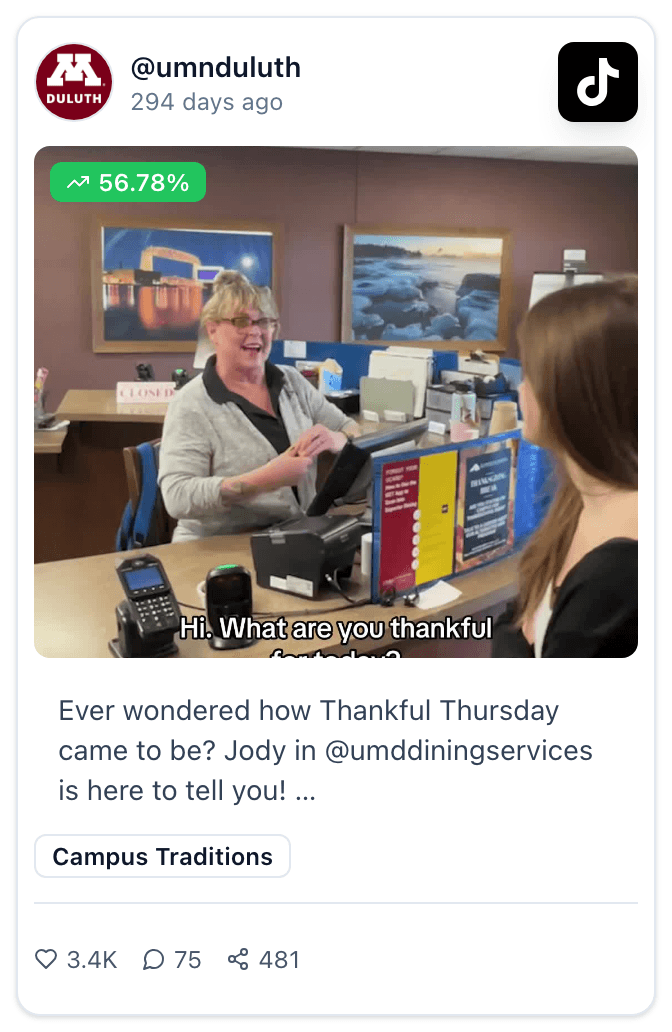
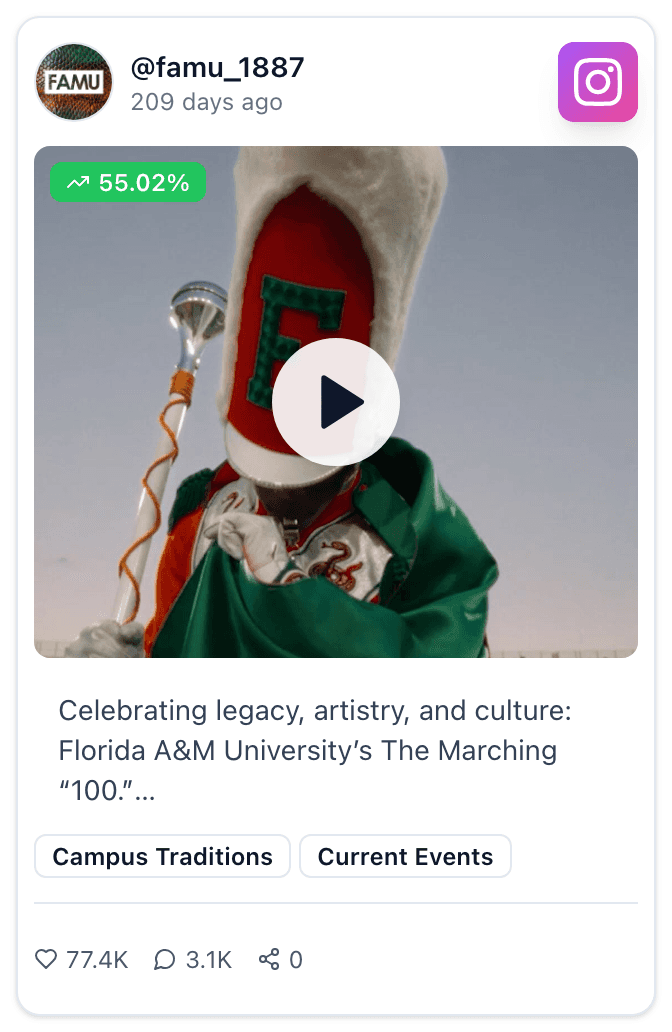
Minnesota Duluth had a dining services staffer explain how Thankful Thursday started, which turns a weekly habit into a story told by the person who runs it. FAMU went the other way and pointed a camera at a Marching 100 drum major in full regalia on the field, captioned "Celebrating legacy, artistry, and culture," for 77,399 likes.
12. The decade throwback
Nostalgia is index 147 on 0.4% of output, one of the widest gaps on this page, and the raw material is usually already in a shared drive.
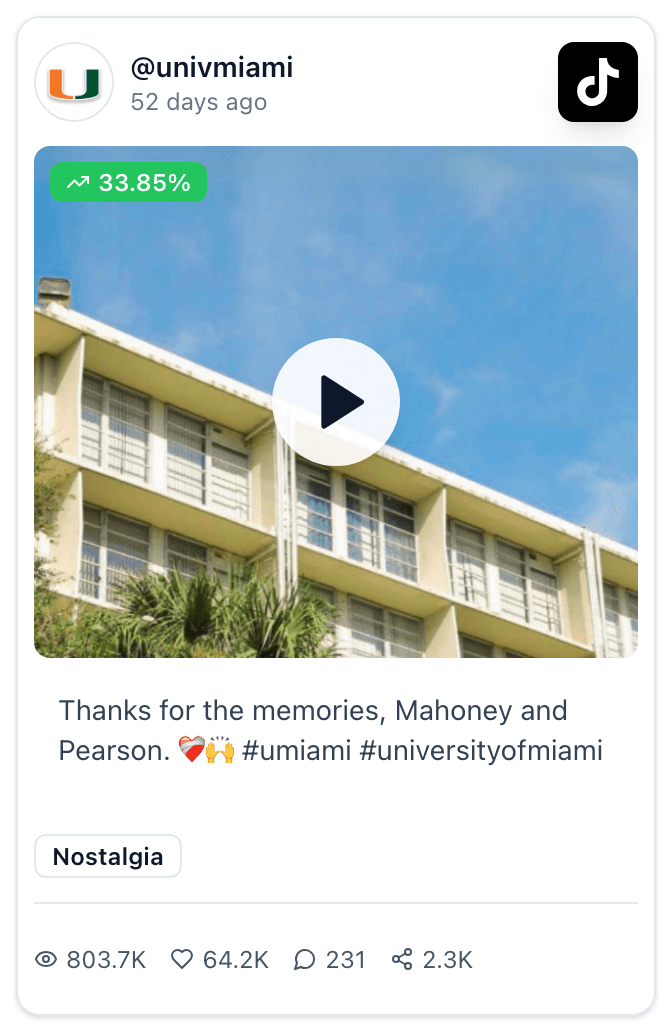
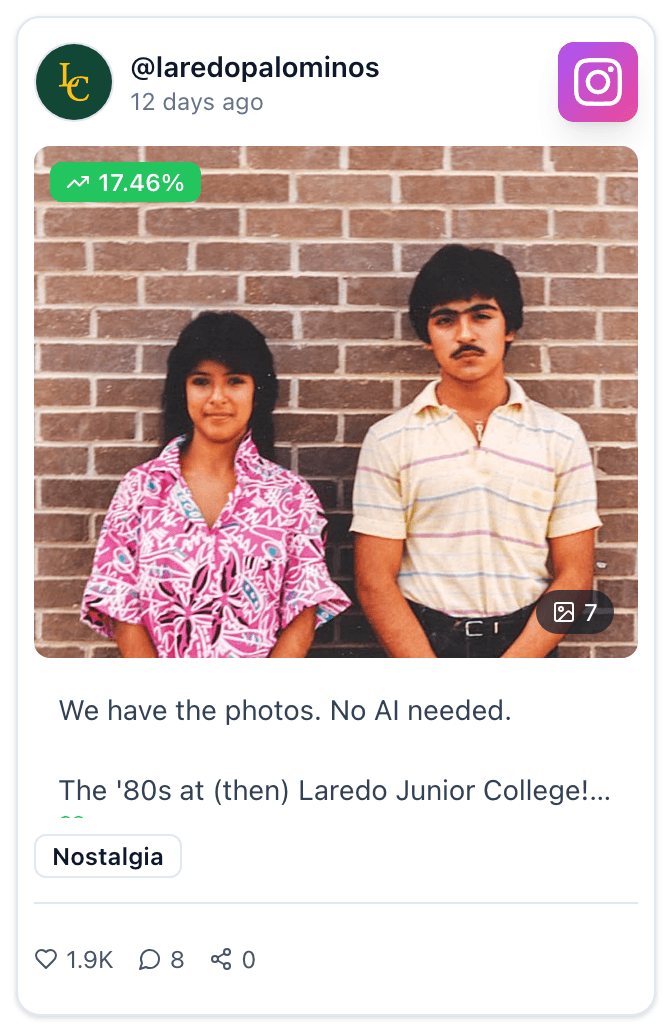
Miami posted a farewell to two buildings coming down and took 64,200 likes. Laredo College posted photographs from the 1980s with the best caption we came across, "We have the photos. No AI needed." This one reaches alumni, which is worth knowing if advancement ever asks what social is doing for them.
Posts that are proof of something
Two ideas that wait for an occasion rather than a date, which makes them worth having a template ready for.
13. The ranking or the championship, stated plainly
Rankings and awards are index 109, just above the median, with an enormous spread inside the category. The size of the claim seems to be what separates the two ends of it.
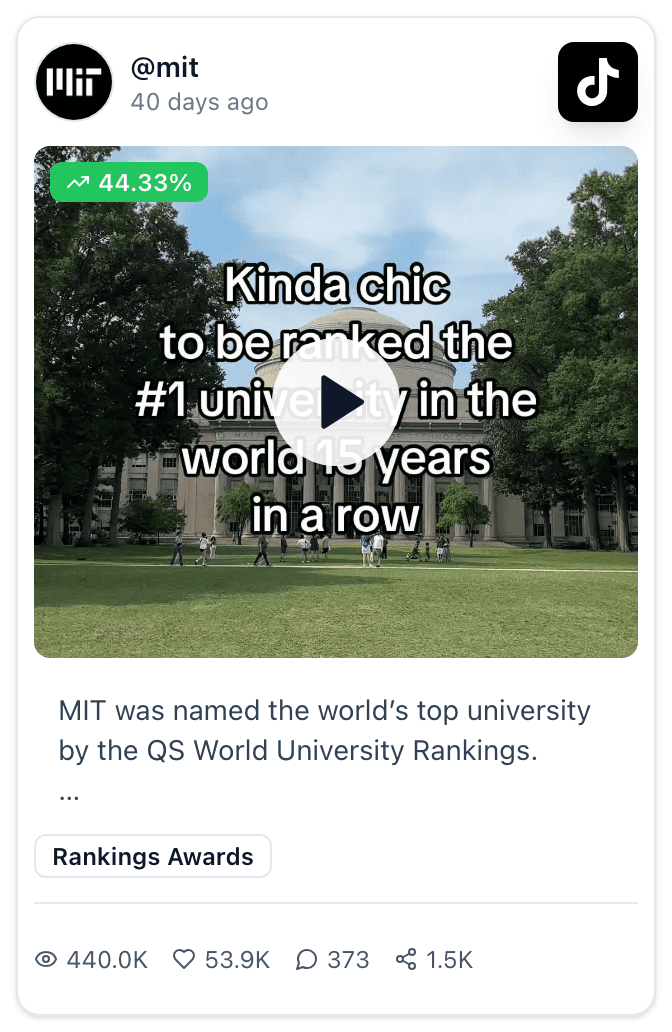
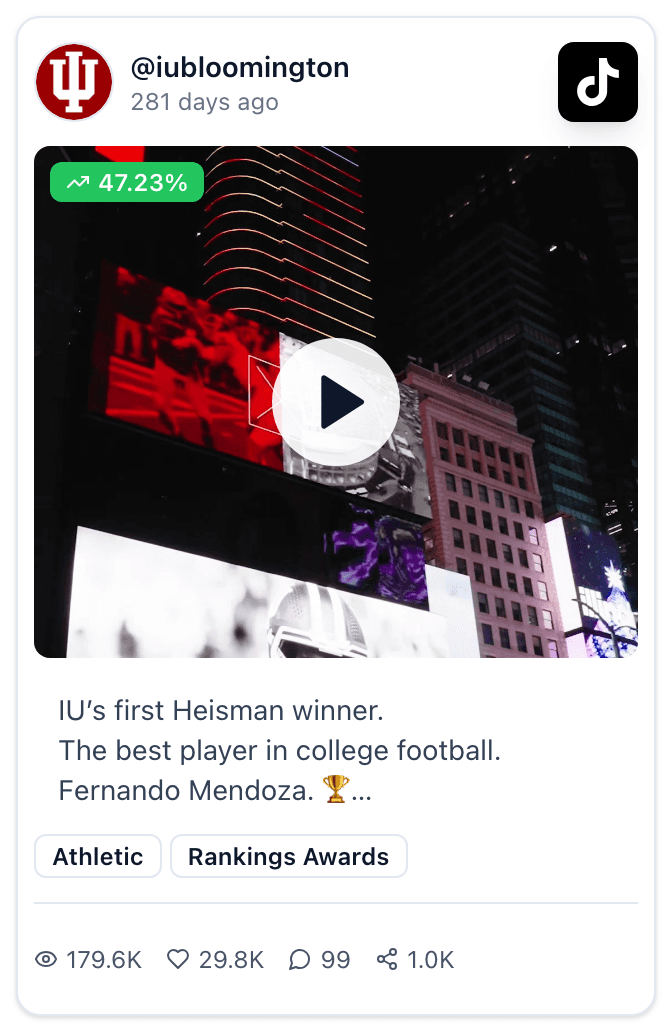
MIT announced being named the world's top university by QS and earned 53,900 likes. Indiana posted their first Heisman winner for 29,800. What those share is a claim a student would repeat to a friend, which is also why a regional placement in a narrow category tends to go nowhere.
14. Bid day and the Greek reveal
Greek life is index 153 on 0.2% of higher ed output. That is the widest gap between performance and volume in the entire dataset, and it produced the single largest post we found.
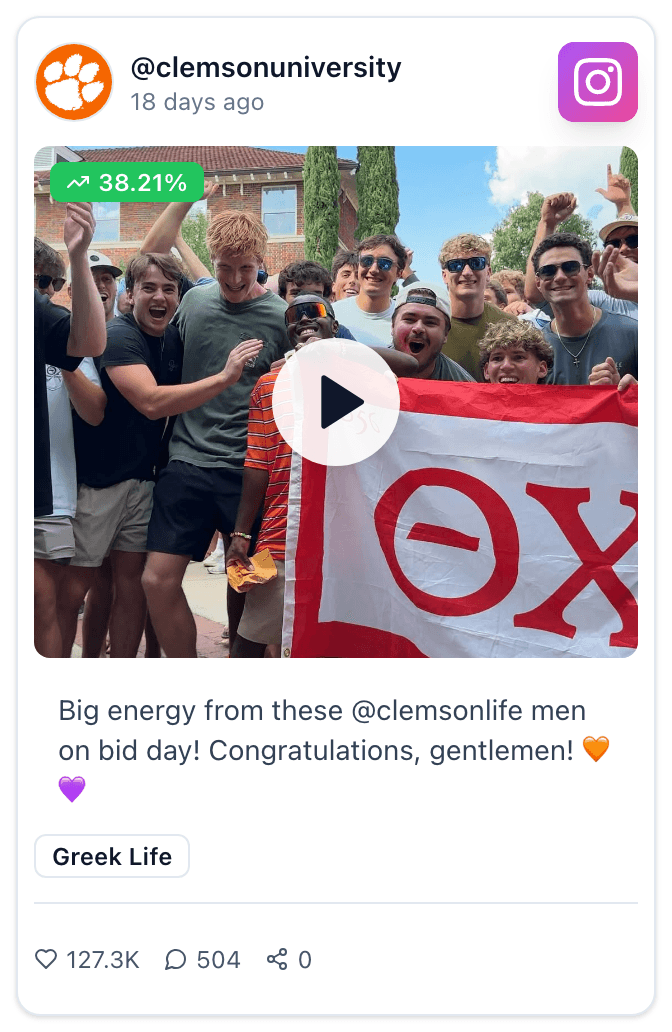
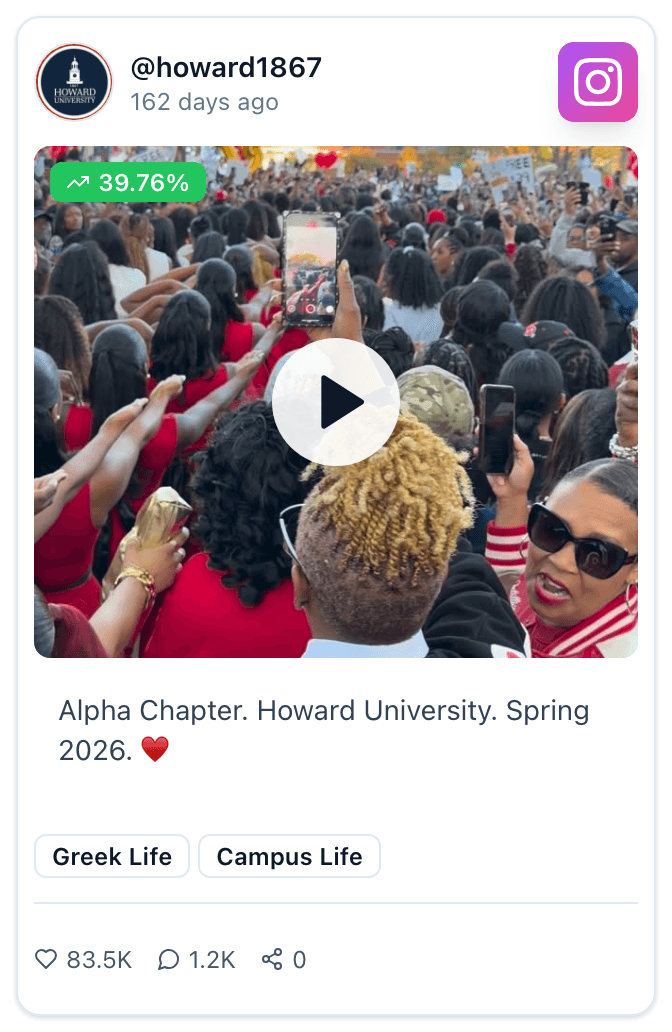
The largest post in the entire dataset is a bid day post, and it is worth looking at closely. Clemson's ran for ClemsonLIFE, their program for students with intellectual disabilities, captioned "Big energy from these @clemsonlife men on bid day." It earned 127,328 likes, more than any other post across all 522,407. Howard's Alpha Chapter post took 83,470.
So the top of this category is not simply Greek recruitment content. It is an inclusion story that happened to be told through bid day. Whether a central account posts this at all is a governance question as much as a content one, and it will not be the same answer everywhere. What the data says is only that the audience turns up for it.
Posts tied to the academic calendar
These six are the strongest performers on the list, and each one has a window. Bookmark this section and come back to it when the window opens, or build the template now while there is time.
Idea | Window | Peak share of posts |
|---|---|---|
Move in | August | 7.4% |
Orientation and class year | June through August | 11.4% |
Finals | December, again in April and May | 5.7% |
Commencement | May | 31.4% |
Homecoming | September and October | 5.1% |
15. Move in, from the family's point of view
The strongest category in the dataset. Index 194, close to double the Instagram median, on 0.8% of output. Obviously since it's annual occurence, you want to make the most of it!
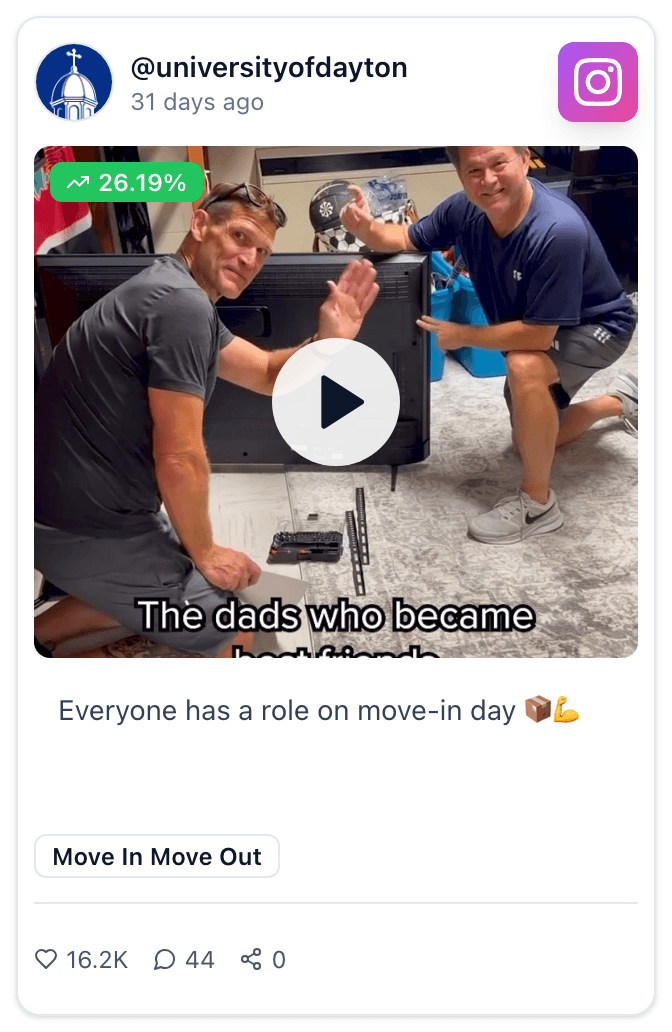
Mississippi State posted a moment between a student and their parents, captioned "A reminder that it's your parents first time moving you into college too," and earned 80,022 likes. Dayton pointed the camera at the dads doing the lifting, captioned "Everyone has a role on move-in day," for 16,185.

16. The packing fail
A second move in angle that works because every family recognises it.
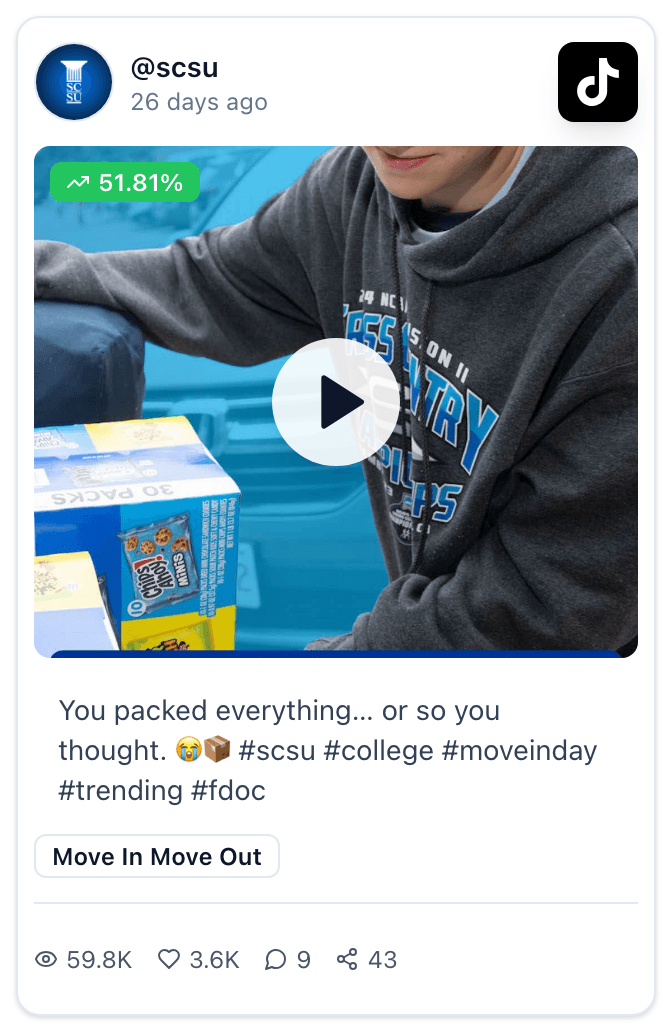
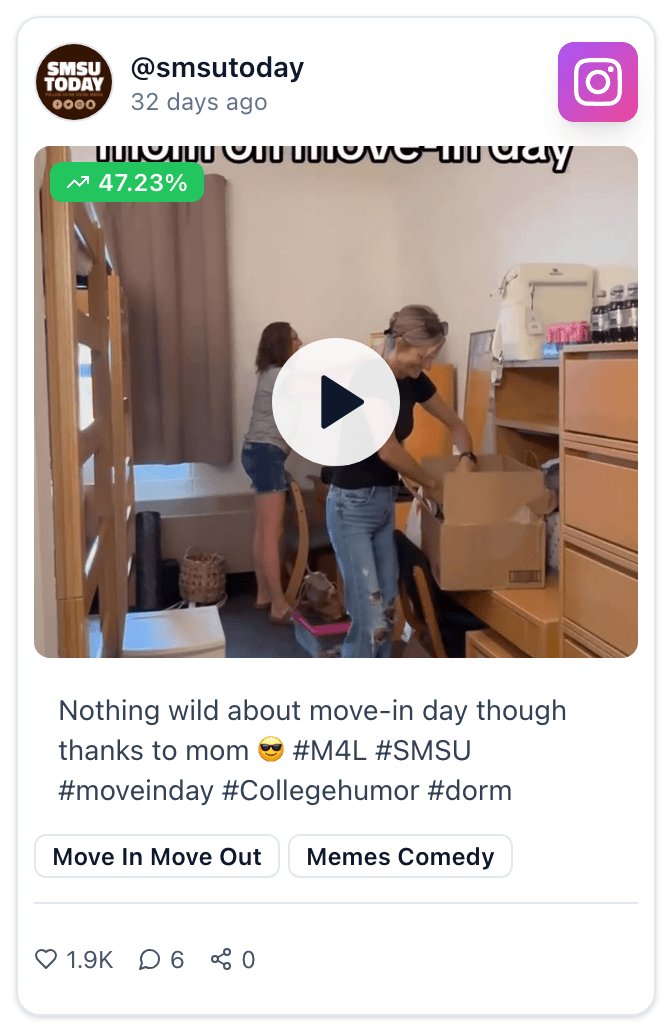
Southern Connecticut State posted "You packed everything, or so you thought." Southwest Minnesota State ran a version crediting mum for the packing. This one needs a phone and a half unpacked car.
17. The class year arrival
Incoming students respond to being named as a cohort. Orientation content is index 147 on 2.5% of output.
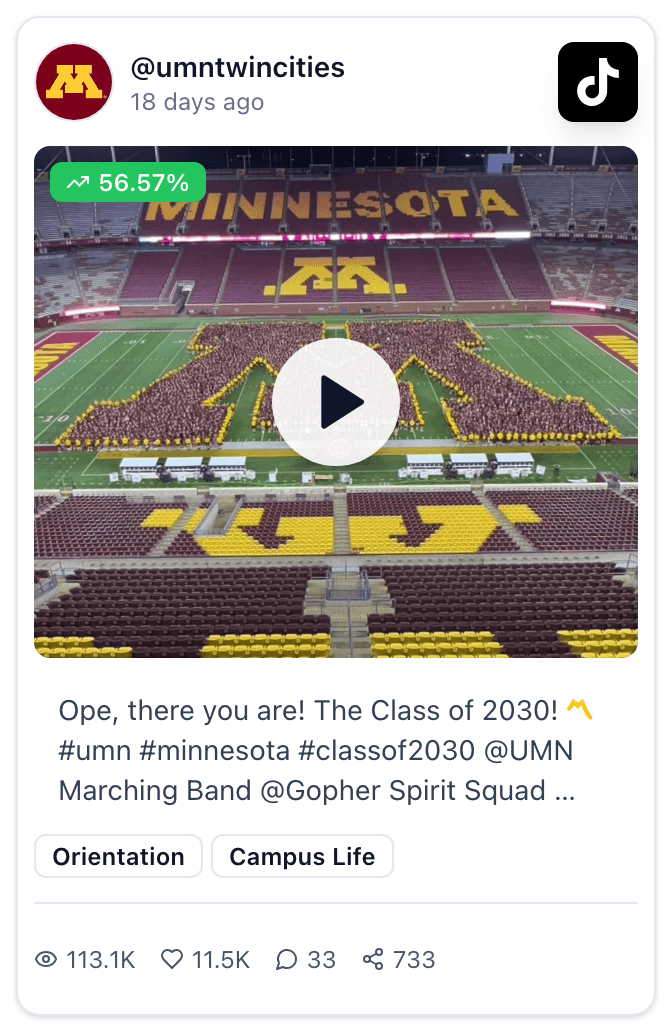
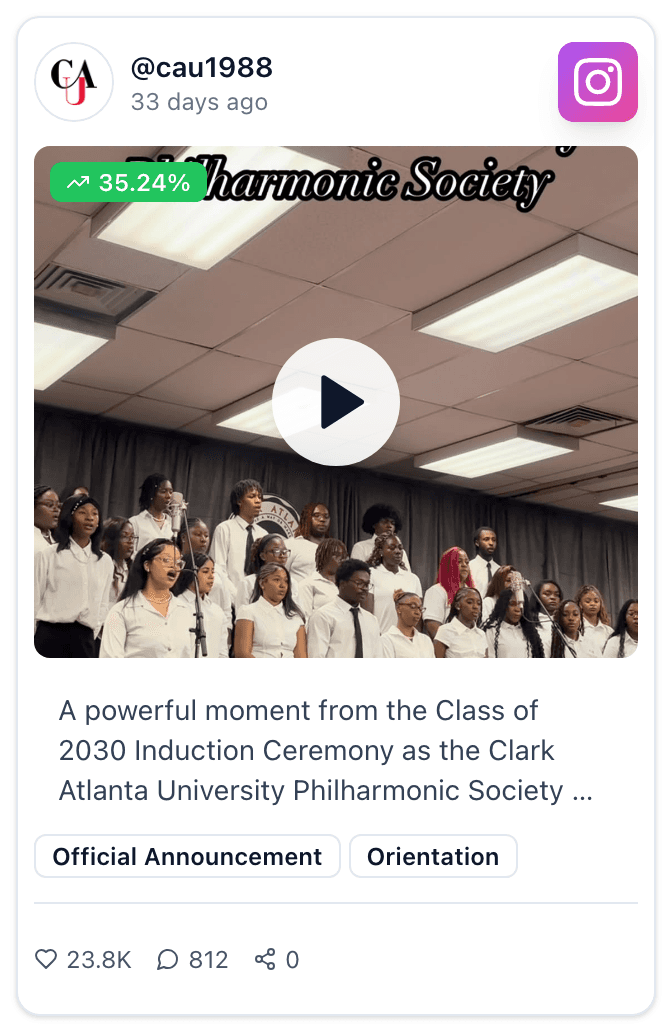
Minnesota Twin Cities brought the marching band out, captioned "Ope, there you are! The Class of 2030." Clark Atlanta posted their induction ceremony for 23,798 likes. The window is wider than it looks.
18. Finals week solidarity
The shared feeling rather than study tips or library hours. Index 131 on 0.8% of output.
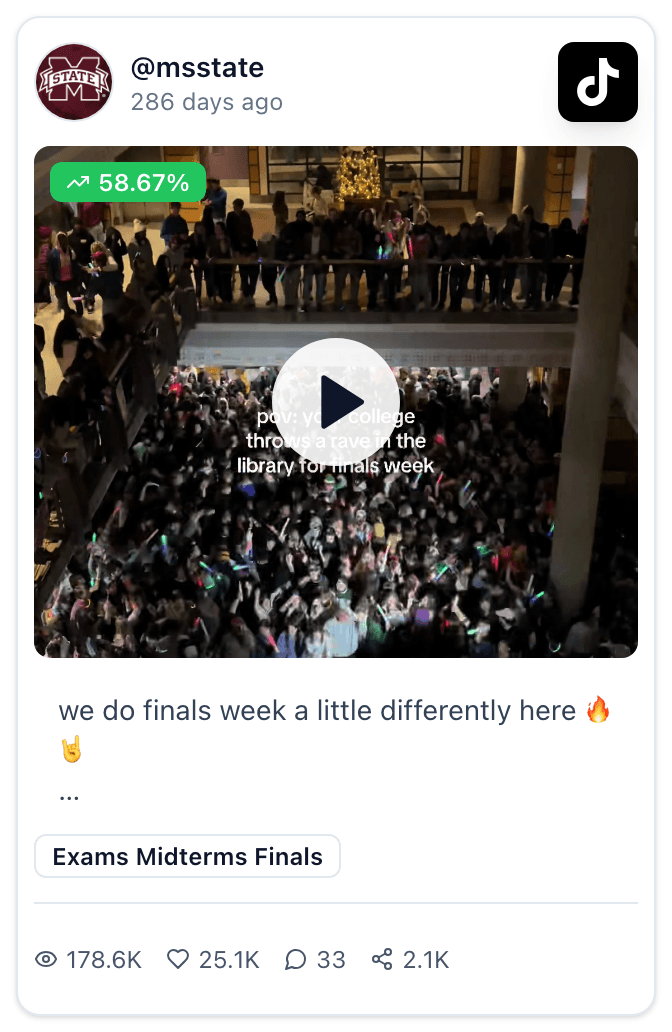
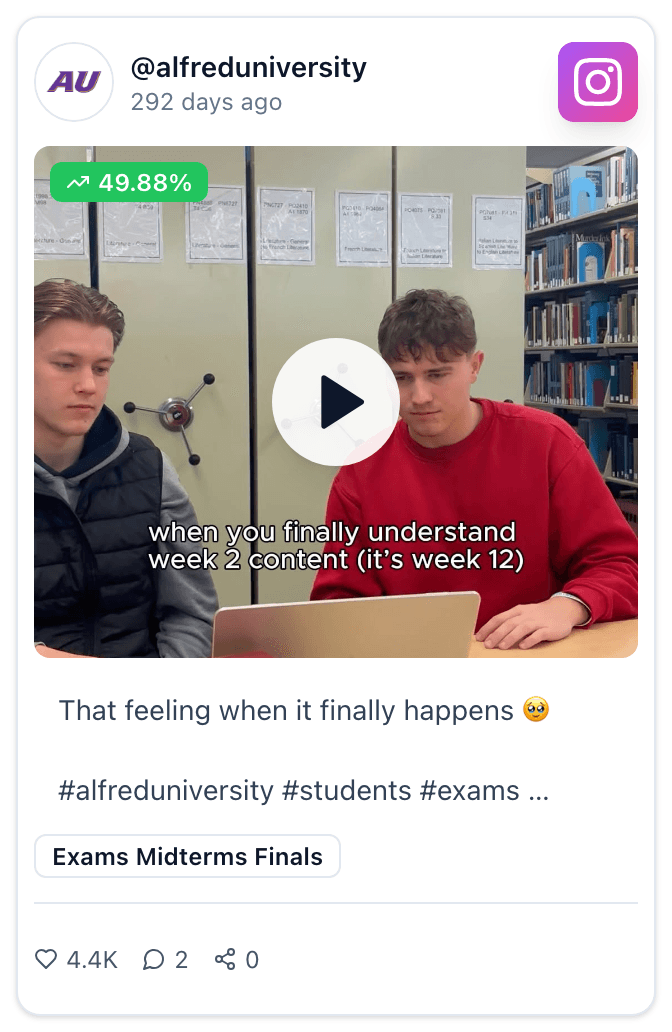
Mississippi State posted "we do finals week a little differently here" and earned 25,100 likes. Alfred University poked fun at exam season with some humor.
19. The commencement moment, not the ceremony
May is the most concentrated month in higher ed social. Graduation content takes 31.4% of everything posted, so the feed is crowded and a ceremony recap has to work hard.
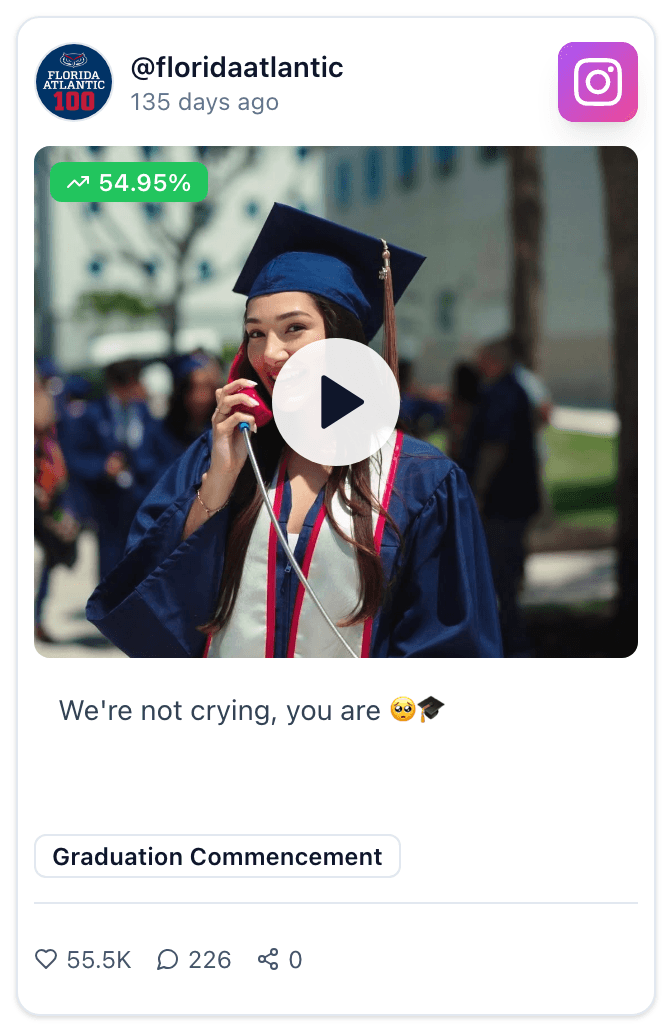
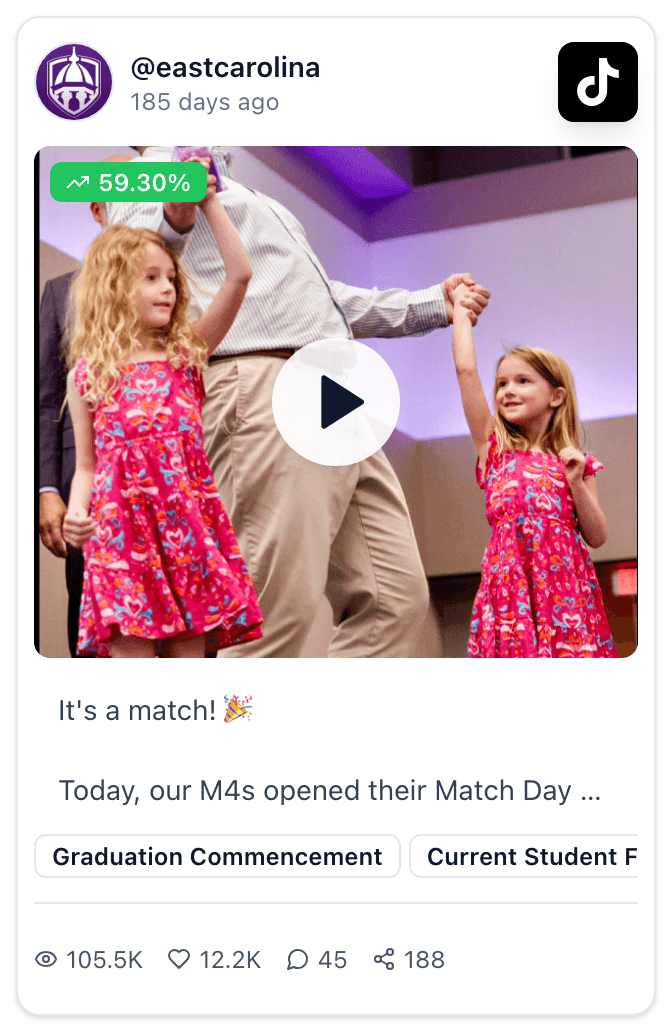
Florida Atlantic posted "We're not crying, you are" and earned 55,532 likes. East Carolina found a version outside May entirely, filming medical students opening Match Day envelopes in March.
20. The homecoming announcement
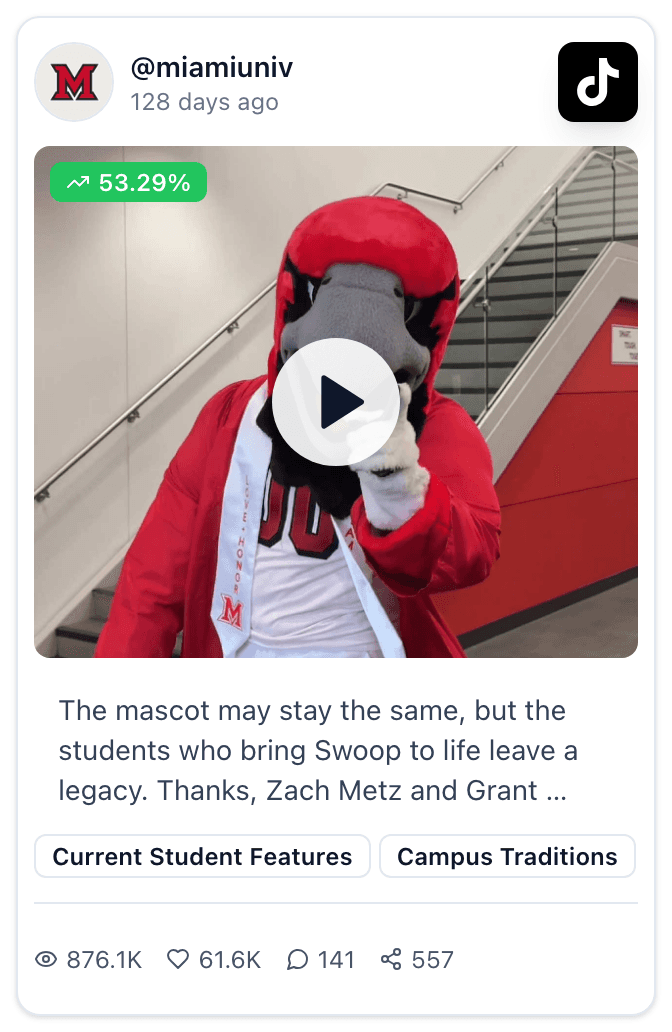
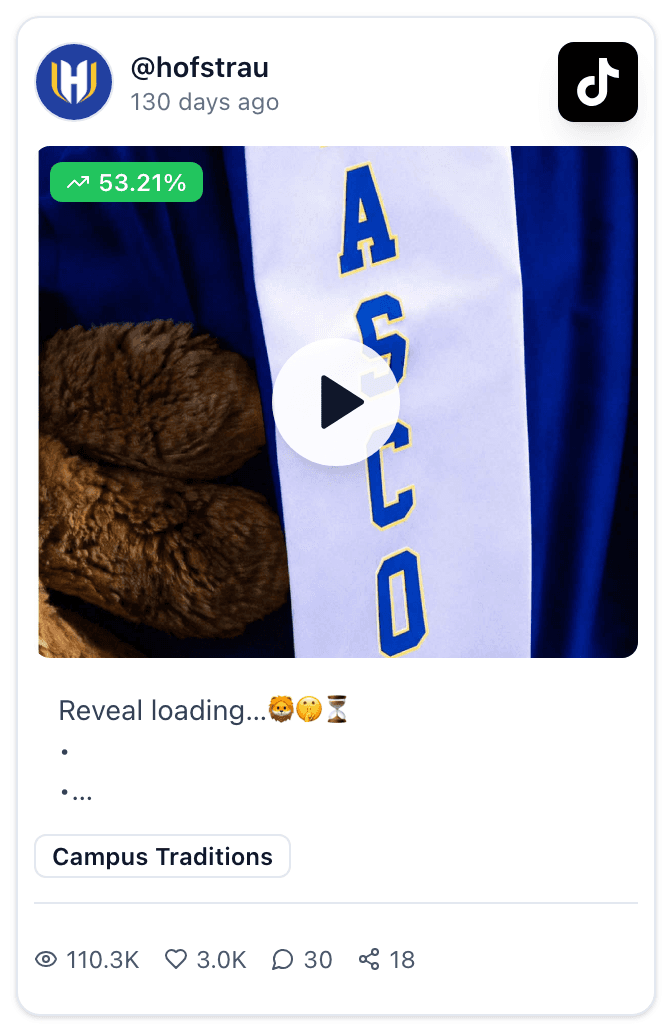
This one is not in any content calendar we have seen, and two schools independently ran it in the same week in May. Both cleared 53%.
Miami revealed the student who had been inside Swoop, captioned "The mascot may stay the same, but the students who bring Swoop to life leave a legacy," and earned 61,600 likes. Hofstra teased theirs with nothing but "Reveal loading" and a lion.
Every campus with a mascot has a student in the suit and a graduation date. It only works once a year, and it is the rare senior send off that is not another commencement photo.
The posts that will never top this list
The ranking has a bottom as well as a top, and it is worth knowing where it is. Eight categories sit consistently below the median, and together they make up 24.4% of everything higher education publishes on Instagram.
Category | Index | Share of posts |
|---|---|---|
Academic content | 58 | 6.3% |
Open house and event promotion | 65 | 6.1% |
Donor and fundraising | 59 | 3.8% |
Program and major highlights | 64 | 3.0% |
Research and innovation | 55 | 2.7% |
Resources and tips | 52 | 2.5% |
Deadline reminders | 58 | 1.8% |
Financial aid content | 44 | 1.5% |
None of that means stop making them.
A deadline reminder has to reach students before the deadline. Financial aid content exists because somebody needs the information and has nowhere else to get it. A donor post sometimes runs for an audience of one, and keeping that person happy is a real outcome that engagement rate was never going to measure. These posts are doing a job. It is just not the job the rest of this page is about.
What the numbers are useful for is setting expectations before the post goes out.
Agree what the post is for. When a department asks for something, the question worth asking is what success looks like. A deadline reminder works if the people who needed the deadline saw it. Held up against a move in reel it will always look like a failure, and that comparison usually lands on the social team rather than on whoever asked for the post.
Change the format even when you cannot change the content. This is where most of the available gain is. Publishing as a carousel rather than a single image is worth more than almost anything else you could do to a post that has to run as written.
Borrow a format from the twenty above. Research and program content performs when a person explains their own work on camera, which is much closer to idea 7 than to a link and a press release. Same information, different container.
Where to start
Twenty ideas is more than any team is going to add at once, so if this turns into three decisions it has done its job.
Pick one underused category. Greek life, dorm content, throwbacks and finals week all beat the median while sitting under one percent of higher ed output. Every one of them is already happening on campus. Nobody is filming it.
Make one format change. Carousels earn 2.6 times what single images earn on Instagram. That is one extra slide, applied to posts you were making anyway, including the ones from the section above that have to run regardless.
Build one thing before its window opens. Move in is August, finals are December, commencement is May. The posts that perform in those weeks are the ones that existed before the week started, which is the whole argument for coming back to the calendar section in July rather than in August.
The ranking in this piece covers twelve months, so it is the durable version. If you want to see which categories and formats are moving right now, we keep a live view of higher ed content performance that updates daily across Instagram, Facebook and TikTok, and you can benchmark your own accounts against the institutions in this dataset.
Frequently asked questions
What are the best social media ideas for colleges?
Across 522,407 posts from 5,386 higher education accounts, the strongest performing content types on Instagram are move in and move out, graduation and commencement, Greek life, orientation, nostalgia, memes and comedy, aesthetic campus content, dorm and housing, finals week, and campus traditions. Move in content earns roughly double the platform median and makes up 0.8% of what institutions actually post. The live category rankings update daily across all three platforms.
How often should a college post on social media?
There is no single number that holds across institutions, and cadence matters less than most strategy guides suggest. Format is the larger lever. On Instagram a carousel earns 2.6 times what a single image earns, so a school posting three carousels a week will usually outperform one posting six single images. Our higher ed benchmarks show median posting frequency by platform if you want a starting point.
What is a good engagement rate for a college or university?
The median across higher education accounts is 1.34% on Instagram, 2.08% on TikTok and 0.11% on Facebook. Anything above those is above average for the sector. Be careful comparing against averages rather than medians, because a small number of very large posts pulls averages well above what a normal week looks like.
What should colleges post on TikTok?
TikTok rewards a narrower spread than Instagram does, so execution matters more than category choice. The strongest categories are homecoming, dorm and housing, move in, commencement and orientation. Campus life takes 20.2% of higher ed TikTok output and performs only slightly above the platform median, so it is worth breaking that habit into more specific ideas. The TikTok benchmarks lets you compare your account against peers.
Which social media content underperforms for colleges?
Eight categories sit consistently below the median engagement rate while making up 24.4% of Instagram output between them. They are academic content, open house and event promotion, donor and fundraising, program and major highlights, research and innovation, resources and tips, deadline reminders, and financial aid content. Most of these have to be published regardless of how they perform, because they carry information students need or serve an audience other than the feed. The useful move is to agree what each post is for before it goes out, and to publish it in a stronger format, since carousels earn 2.6 times what single images earn. A free opportunity assessment will show how your own content mix is split across these categories.
Where does this data come from?
We analyzed 522,407 public posts published between September 2025 and September 2026 by 5,386 accounts at 2,371 colleges and universities. All figures are median engagement rates. Categories are assigned automatically, and posts can carry more than one, so share figures describe the portion of posts tagged with a category rather than a clean split of the total. The dataset powers Reach, our social media platform for higher education, and we publish new findings from it every week in the Reach Report.
See where your own accounts land
Every number on this page is the higher ed median. The more useful number is yours.
Reach is the social media platform built for higher education, and it measures your accounts against the same institutions behind this analysis.
Run a free opportunity assessment. See how your content mix and engagement compare with your peers.
Browse the higher ed benchmarks for Instagram, Facebook and TikTok, updated daily.
Subscribe to the Reach Report, a weekly read on what is working in higher ed social.


